
Figures & data
Table 1 Clinical and demographic characteristics of the patients
Figure 1 Study recruitment profile.
Abbreviation: PSD, post-stroke depression.
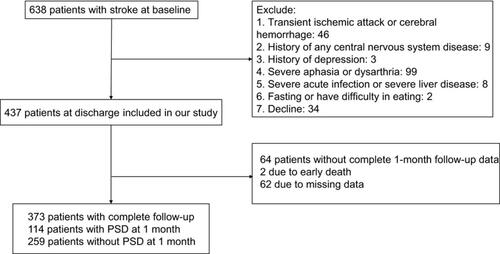
Figure 2 Comparisons of HDL-C, LDL-C and LDL/HDL ratios in patients with and without PSD. (A) HDL-C levels, (B) LDL-C levels, (C) LDL/HDL ratio. In the box-and-whisker plots, the horizontal line in the middle of each box indicates the median value; the lower and upper ends of the box represent the 25th and 75th percentiles, and the peripheral lines extending to the outer fences represent minimum to maximum, respectively. (A), (B) used two-tailed unpaired t-test; (C) used Mann–Whitney U-test. **P<0.01, ***P<0.001.
Abbreviations: PSD, post-stroke depression; HDL-C, high-density lipoprotein cholesterol, LDL-C, low-density lipoprotein cholesterol.
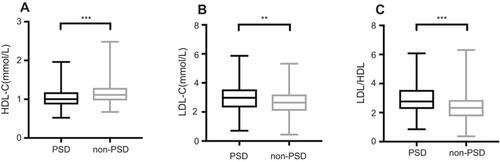
Table 2 Correlation coefficients evaluating the relationship of Hamilton Depression Scale scores and lipid profiles and other potential confounding variables
Table 3 LDL/HDL ratios across quartiles of patients
Table 4 Clinical and demographic characteristics of patients in each quartile
Table 5 Multivariate logistic model of the clinical determinants of PSD
Table S1 Clinical and demographic characteristics of the excluded and included samples