Figures & data
Figure 1 Protocol for the experiment. All other experimental procedures were done after the interventions. Rats were killed after the last test.
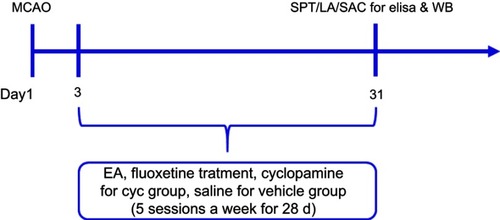
Figure 2 Improvement in depressive-like behaviors of PSD. (A) Effect of EA treatment on SPT; (B) changes in locomotion activity after EA treatment. Values are presented as means ± SEM, with eight rats in each group. **P<0.01 versus sham group; ***P<0.001 versus sham group; ##P<0.01 versus PSD group; ###P<0.001 versus PSD group; &&P<0.01 versus EA group; %P<0.05 versus EA + Cyc group.
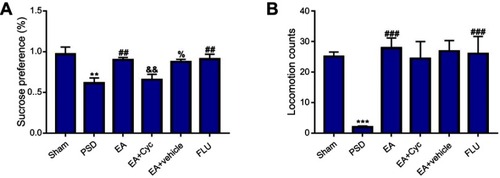
Figure 3 Alleviation of oxidative stress and inflammation. (A–F) Comparisons of SOD, GSH, MDA, IL6, TNFα, and IL1β levels in sham, PSD, EA + PSD, EA + Cyc, EA + vehicle, and Flu groups by ELISA. Values are presented as means ± SEM, with eight rats in each group. **P<0.01 versus sham group; #P<0.05 versus PSD group; ###P<0.001 versus PSD group.
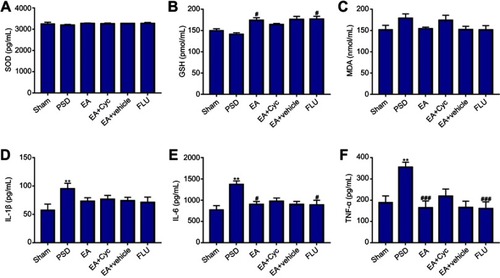
Figure 4 Changes in 5HT levels. Comparison of 5HT levels in sham, PSD, EA + PSD, EA + Cyc, EA + vehicle, and Flu groups by ELISA. Values are presented as means ± SEM, with eight rats in each group. **P<0.01 versus sham group; ##P<0.05 versus PSD group; &P<0.05 versus EA group; %P<0.05 versus EA + Cyc group.
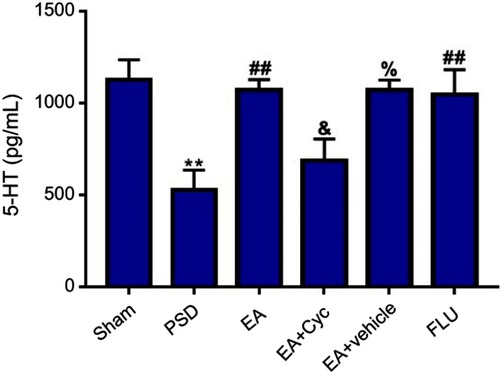
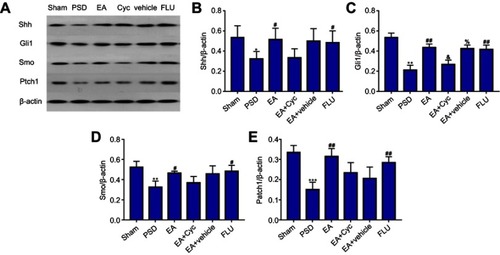
Figure 5 Regulation of Shh-signaling pathway. (A) Immunoblot analysis for expression of Shh, Gli1, Smo, Ptch1, and β-actin in sham, PSD, EA + PSD, EA + Cyc, EA + vehicle, and Flu groups. (B–E) Comparisons of Shh, Gli1, Smo, and Ptch1 levels in six groups by Western blot. Values are presented as means ± SEM, with eight rats in each group. *P<0.05 versus PSD group; **P<0.01 versus PSD group; ***P<0.001 versus PSD group; #P<0.05 versus PSD group; ##P<0.01 versus PSD group; &P<0.05 versus EA group; %P<0.05 versus the EA + Cyc group.