
Figures & data
Figure 1 Flowchart of the recruitment of participants.
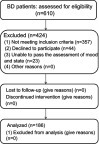
Table 1 Distribution of independent variables measured from 186 patients with BD
Figure 2 Histogram of resulting lithium concentration in 186 patients with bipolar disorder.
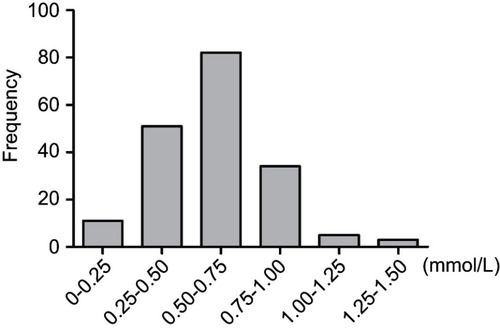
Figure 3 Positive correlations between serum lithium concentration and creatinine (A), Mg2+ (B) concentrations, and percentage of neutrophils (C) in 186 patients with bipolar disorder.
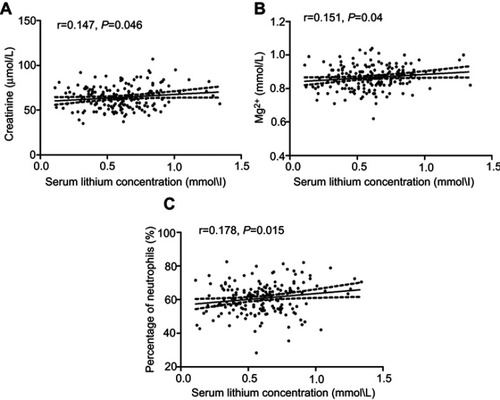
Figure 4 Negative correlations between the serum lithium concentration and HDL (A), apolipoprotein A1 (B), and Na+ concentrations (C) in186 patients with bipolar disorder.
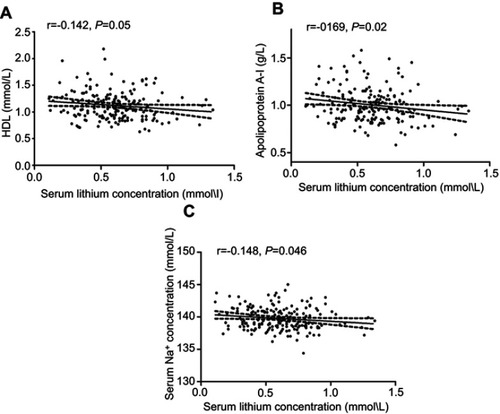
Table 2 Multiple linear regression analysis between the serum lithium concentrations (dependent variable) and the creatinine, HDL, apolipoprotein A1, Na+, Mg2+ concentrations, and percentage of neutrophils (independent variables)