
Figures & data
Figure 1 Illustration of the (A) saturated structural equation model (SEM) and (B) G-computation model.
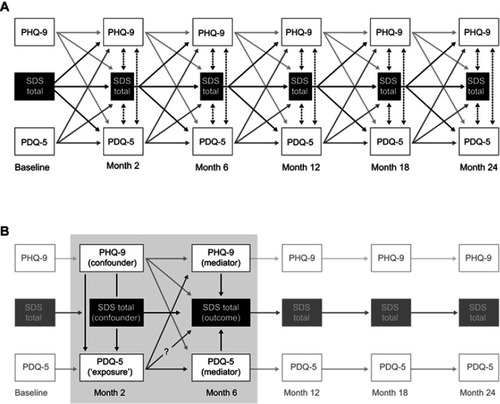
Table 1 Summary statistics of PDQ-5 score, SDS total score, and PHQ-9 score by visit
Figure 2 Distribution of depression severity (9-item Patient Health Questionnaire [PHQ-9] score, range 0–27), functional impairment (Sheehan Disability Scale [SDS] total score, range 0–30) and cognitive symptoms (5-item Perceived Deficit Questionnaire [PDQ-5] score, range 0–20) by visit.
![Figure 2 Distribution of depression severity (9-item Patient Health Questionnaire [PHQ-9] score, range 0–27), functional impairment (Sheehan Disability Scale [SDS] total score, range 0–30) and cognitive symptoms (5-item Perceived Deficit Questionnaire [PDQ-5] score, range 0–20) by visit.](/cms/asset/abd21007-7ec4-407a-80e9-8e838c77a4c3/dndt_a_206825_f0002_b.jpg)
Figure 3 Significant regression coefficients based on the structural equation model standardized by time point.
Abbreviations: PDQ-5, 5-item Perceived Deficit Questionnaire; PHQ-9, 9-item Patient Health Questionnaire; SDS, Sheehan Disability Scale.
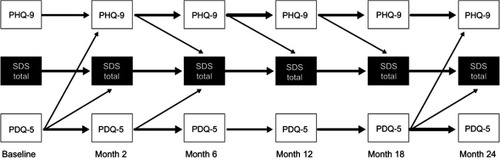
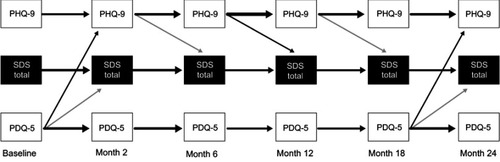
Figure 4 Causal effect sizes from G-computation standardized by time point.
Abbreviations: PDQ-5, 5-item Perceived Deficit Questionnaire; PHQ-9, 9-item Patient Health Questionnaire; SDS, Sheehan Disability Scale.
Data availability
The authors declare that the data supporting the findings of this study are available within the article. The authors may be contacted for further data sharing.