Figures & data
Figure 1 KIM score of white matter lesions. A, B, C, three layers of the brain (A=centrum semiovale, B=lateral ventricular body, C=basal ganglia); KIM score of each layer: 1 – small cap or thin lining lesion or punctuated lesion; 2 – larger cap or smooth halo lesion or more punctuated lesion with confluence; 3 – extending cap or irregular extended hyperintensity or lesion with massive confluence.
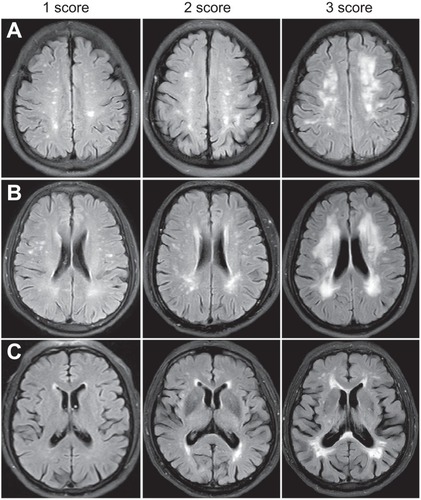
Figure 2 Reference lines and regions of interest for the assessment of cerebral blood flow. (A) Reference lines on the sagittal images. Line 1 – the tangent line at the top of the corpus callosum corresponding the layer of centrum semiovale; line 2 – the middle points of line 1 and line 3 corresponding the layer of lateral ventricular body; line 3 – the line that connects the antecornu and postcornu of the lateral ventricle the layer of basal ganglia. (B) ROIs for CBF assessment and corresponding KIM classification. 1, 2, 3 – three layers of the brain (1=centrum semiovale, 2=lateral ventricular body, 3=basal ganglia); green – JCWM; red – DWM; blue – PVWM; yellow – JVWM.
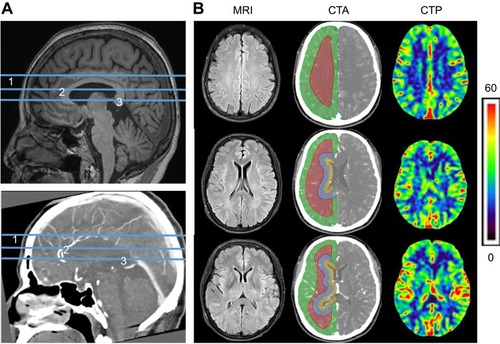
Table 1 Demographic and clinical characteristics of subjects in AD and control group
Figure 3 KIM score of different regions and their correlation with MoCA score. (A) KIM scores in the AD group and control group. (1) The non-parametric test for KIM scores between AD group and control group. The KIM score of JVWML was significantly different between two groups (P<0.05) while there was no marked difference in the KIM score of other regions between two groups. 2) Severe WMLs in AD group and control group. AD group had a higher prevalence of severe PVWML and JVWML. (B) Correlation between KIM score and MoCA score in the AD group and control group. For WML of different regions, there was no relationship between KIM score of JCWMLs and MoCA score; the KIM scores of DWMLs, PVWMLs and JVWMLs were negatively related to the MoCA score in the AD group, but this was not found in the control group. *P<0.05, **P<0.01.
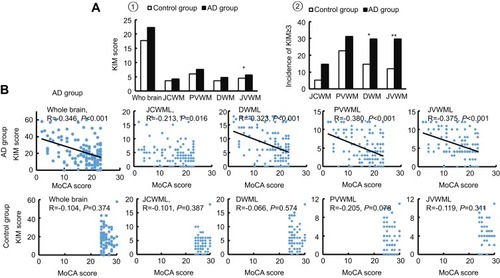
Figure 4 CBF and its correlation with KIM scores of WML. (A) CBF in the AD group and control group. *P<0.05, **P<0.01. Compared with the control group, the total CBF and regional CBF in the AD group reduced, and the mean CBF of the whole brain (26.98±10.48 vs 31.10±9.48, P=0.007), JVWM (26.12±10.70 vs 30.70±9.05, P=0.001), PVWM (21.52±8.86 vs 24.70±8.18, P=0.012), DWM (23.22±9.55 vs 26.71±8.58, P=0.010) and JCWM (37.07±15.47 vs 42.29±13.13, P=0.011) were significantly different between the two groups. (B) Correlation between CBF at different regions and KIM score. JVWMLs and PVWMLs (r=−0.308 and −0.219, P<0.05) had close relationships with corresponding CBF in the AD group, while the KIM scores of JCWMLs and DWMLs had no relationships with the CBF of corresponding brain regions. The relationship between KIM score and CBF at different regions was not observed in the control group.
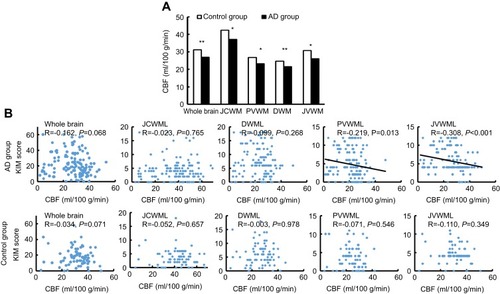
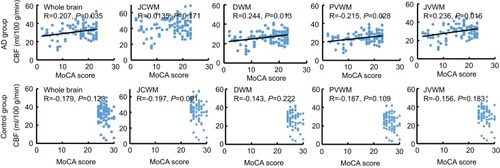
Figure 5 Correlation between CBF and MoCA score in the AD and control group. In the AD group, the CBF of the whole brain, DWM, PVWM and JVWM showed a positive relationship with the MoCA score (r=0.184, 0.141 and 0.155, P<0.05) while the CBF of JCWM had no relationship with MoCA score. There was no close correlation between CBF at different regions and MoCA score in the control group.