Figures & data
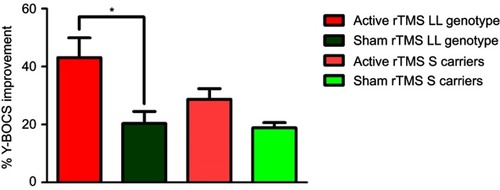
Figure 1 CONSORT diagram for a sham-controlled study of rTMS for patients with OCD.
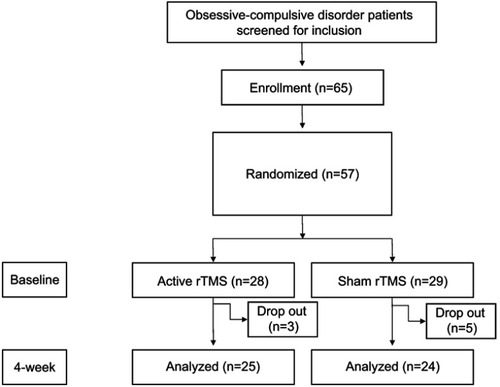
Table 1 Demographic and clinical data of the OCD patients at baseline
Table 2 Assessment scores of OCD patients after treatment
Figure 2 Change in Y-BOCS scores in patients with OCD during the study. Data are shown at the time of inclusion in the study (baseline) and after the period of active or sham stimulation (weeks 2 and 4). *p<0.05 compared with sham rTMS group.
Abbreviaions: Y-BOCS, Yale-Brown obsessive compulsive scale; OCD, obsessive-compulsive disorder; rTMS, repetitive transcranial magnetic stimulation.
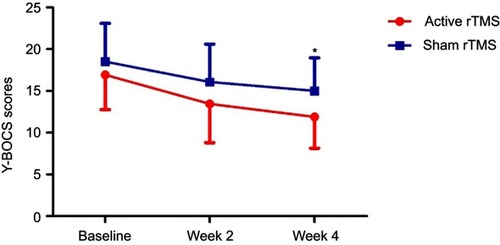
Figure 3 Impacts of 5-HTTLPR on the beneficial effects of rTMS. OCD patients with the LL genotype in the 5-HTTLPR gene (n=4) showed greater improvement in obsessive and compulsive symptoms from low-frequency rTMS than from sham rTMS in patients (n=3) with the LL genotype. Conversely, no significance difference was noted between the active rTMS group in S allele carriers compared with the sham rTMS S allele carrier group (*p<0.05).