
Figures & data
Table 1 Demographic data and clinical measures for the cervical spondylotic myelopathy patients and healthy controls
Figure 1 The scatter plot with duration of symptoms and JOA score of CSM patients.
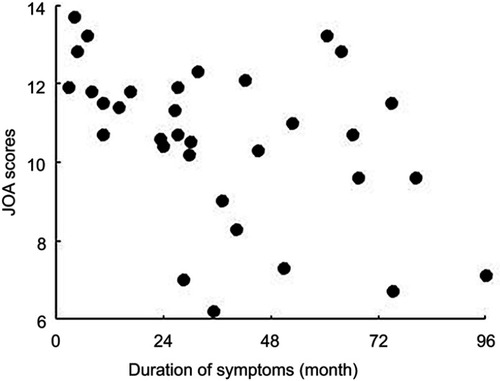
Table 2 zALFF and zReHo differences between the two groups (P<0.01, cluster-wise FDR corrected)
Figure 2 zALFF and zReHo differences between the two groups (P<0.01, cluster-wise FDR corrected). Red-yellow spots, CSM>HC.
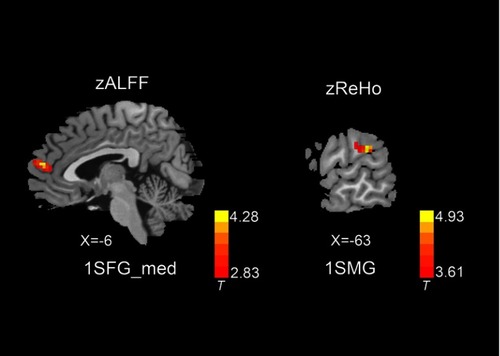
Table 3 Functional connectivity differences between the two groups (P<0.01, cluster-wise FDR corrected)
Figure 3 Functional connectivity differences between the two groups, lSFGmed selected as seed ROI (P<0.01, cluster-wise FDR corrected). Red-yellow spots, CSM>HC; blue spots, CSM<HC.
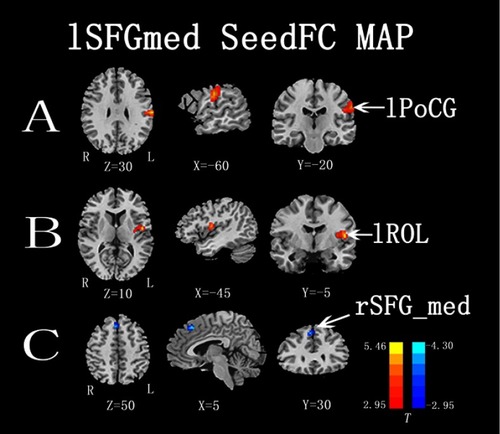
Figure 4 Functional connectivity differences between the two groups, lSMG selected as seed ROI (P<0.01, cluster-wise FDR corrected). Red-yellow spots, CSM>HC.
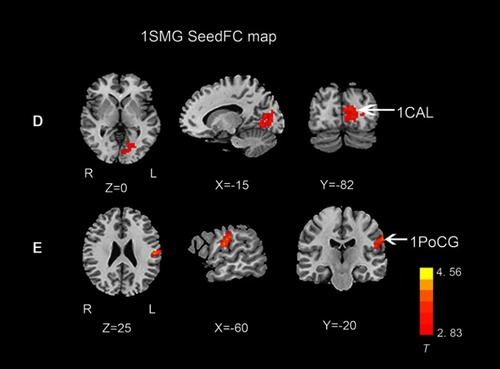
Table 4 Correlation between altered zALFF, zReHo, and functional connectivity with clinical measures in the CSM group