
Figures & data
Figure 1 sEH inhibitor improved recovery of neurological function at 1 and 3 days after MCAO.
Notes: The sensorimotor function of MCAO rats treated with or without AUDA was examined in (A) beam walk score (n=6/group) and (B) footslips percentage in beam walk test (n=6/group). Data are presented as mean ± SEM. *P<0.05, **P<0.01.
Abbreviations: IS, ischemia; AUDA, 12-(3-adamantan-1-yl-ureido)-dodecanoic acid; MCAO, middle cerebral artery occlusion; sEH, soluble epoxide hydrolase; SEM, standard error of the mean.
Abbreviations: IS, ischemia; AUDA, 12-(3-adamantan-1-yl-ureido)-dodecanoic acid; MCAO, middle cerebral artery occlusion; sEH, soluble epoxide hydrolase; SEM, standard error of the mean.
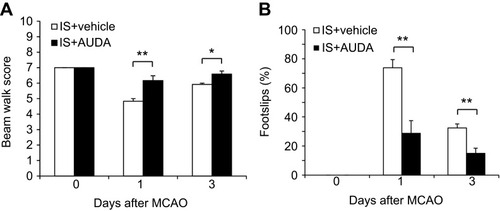
Figure 2 sEH inhibition decreased the infarct volume after MCAO.
Notes: (A and B) Representative brain slices with TTC staining from rats of sham-operated, vehicle treatment and AUDA treatment at 1 and 3 days after MCAO. The pale region indicates the infarct area. (C) Quantification of infarct volume of rats subjected to vehicle treatment and AUDA treatment at 1 and 3 days after MCAO. The sham-operated rats revealed no infarction. n=6/group. Data are presented as mean ± SEM.*P<0.01.
Abbreviations: AUDA, 12-(3-adamantan-1-yl-ureido)-dodecanoic acid; MCAO, middle cerebral artery occlusion; sEH, soluble epoxide hydrolase; SEM, standard error of the mean; TTC, triphenyltetrazolium chloride.
Abbreviations: AUDA, 12-(3-adamantan-1-yl-ureido)-dodecanoic acid; MCAO, middle cerebral artery occlusion; sEH, soluble epoxide hydrolase; SEM, standard error of the mean; TTC, triphenyltetrazolium chloride.
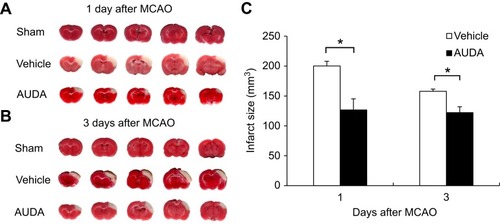
Figure 3 sEH inhibition modulated microglia/macrophages polarization after MCAO.
Notes: (A) Representative immunofluorescent staining of CD86 (green) and Iba-1 (red) in the non-ischemic hemisphere, the ischemic border of rats in vehicle and AUDA treatment groups. Scale bar represents 100 μm. (B) Representative immunofluorescent staining of CD206 (green) and Iba-1 (red) in the non-ischemic hemisphere, the ischemic border of rats in vehicle and AUDA treatment group. Scale bar represents 100 μm. (C) Statistical analysis of CD86+/Iba-1+ or CD206+/Iba-1+ double positive microglia/macrophages in the ischemic border is expressed as cells/mm,Citation2 n=3/group. Data are presented as mean ± SEM.*P<0.05 and **P<0.01.
Abbreviations: AUDA, 12-(3-adamantan-1-yl-ureido)-dodecanoic acid; Iba-1, ionized calcium binding adaptor molecule 1; MCAO, middle cerebral artery occlusion; sEH, soluble epoxide hydrolase; SEM, standard error of the mean.
Abbreviations: AUDA, 12-(3-adamantan-1-yl-ureido)-dodecanoic acid; Iba-1, ionized calcium binding adaptor molecule 1; MCAO, middle cerebral artery occlusion; sEH, soluble epoxide hydrolase; SEM, standard error of the mean.
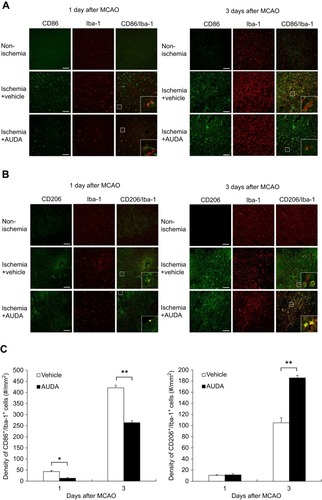
Figure 4 Flow cytometry analysis revealed that the sEH inhibitor suppresses M1 microglia and promotes M2 microglia polarization after MCAO.
Notes: (A) Gating strategy to detect M1 microglia (CD11+CD45intCD86+) and M2 microglia (CD11+CD45intCD206+). In the histograms, the pink regions represented unstained cells (negative control). The green regions on the right of the vertical black lines represented APC-positive (M1) or FITC-positive (M2) cells. (B) The percentage of M1 and M2 microglia of rats in vehicle and AUDA treatment groups, n=4/group. Data are presented as mean ± SEM.*P<0.05.
Abbreviations: APC, allophycocyanin; AUDA, 12-(3-adamantan-1-yl-ureido)-dodecanoic acid; FITC, fluorescein isothiocyanate; MCAO, middle cerebral artery occlusion; PE, phycoerythrin; sEH, soluble epoxide hydrolase; SEM, standard error of the mean.
Abbreviations: APC, allophycocyanin; AUDA, 12-(3-adamantan-1-yl-ureido)-dodecanoic acid; FITC, fluorescein isothiocyanate; MCAO, middle cerebral artery occlusion; PE, phycoerythrin; sEH, soluble epoxide hydrolase; SEM, standard error of the mean.
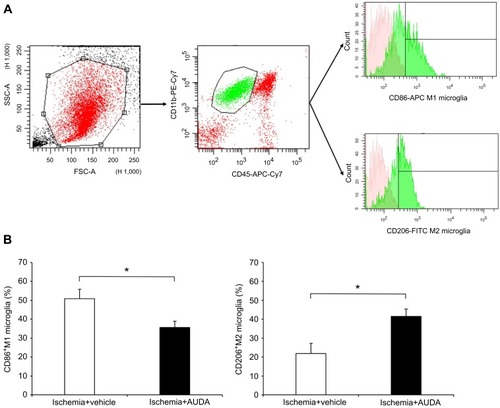
Figure 5 Inhibition of sEH regulated mRNA expression of pro- and anti-inflammatory cytokines and antioxidant mediators at 1 day after MCAO.
Notes: (A) AUDA-regulated mRNA expression of pro- and anti-inflammatory cytokines (IL-1β, IL-6, IL-10, iNOS, MCP-1, MMP-9). (B) AUDA-regulated mRNA expression of antioxidant mediators (CAT, HO-1, Nrf2, PPARγ, SOD-1). Reverse-transcription polymerase chain reaction was performed using total RNA extracted from ischemic cortex tissue (n=4/group) and microglia (n=3‒4/group). Data are presented as mean ± SEM. *P<0.05.
Abbreviations: AUDA, 12-(3-adamantan-1-yl-ureido)-dodecanoic acid; CAT, catalase; HO-1, heme oxygenase-1; IL, interleukin; iNOS, inducible nitric oxidase synthase; MCAO, middle cerebral artery occlusion; MCP-1, monocyte chemoattractant protein-1; MMP-9, matrix metalloproteinase-9; Nrf2, nuclear factor erythroid 2-related factor 2; PPARγ, peroxisome proliferator-activated receptor-γ; sEH, soluble epoxide hydrolase; SEM, standard error of the mean; SOD-1, superoxide dismutase-1.
Abbreviations: AUDA, 12-(3-adamantan-1-yl-ureido)-dodecanoic acid; CAT, catalase; HO-1, heme oxygenase-1; IL, interleukin; iNOS, inducible nitric oxidase synthase; MCAO, middle cerebral artery occlusion; MCP-1, monocyte chemoattractant protein-1; MMP-9, matrix metalloproteinase-9; Nrf2, nuclear factor erythroid 2-related factor 2; PPARγ, peroxisome proliferator-activated receptor-γ; sEH, soluble epoxide hydrolase; SEM, standard error of the mean; SOD-1, superoxide dismutase-1.
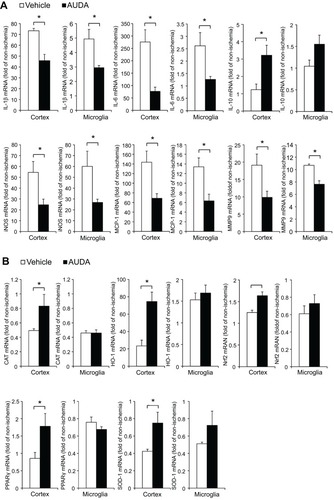
Figure 6 sEH inhibition modulated HO-1 and NeuN expression in neuronal cells at 1 day after MCAO.
Notes: (A) Representative immunofluorescence staining of HO-1 (green) and Iba-1 (red) in the non-ischemic hemisphere, the ischemic border of rats in vehicle and AUDA treatment groups. Scale bar: 100 μm. (B) Representative immunofluorescence staining of HO-1 (green) and NeuN (red) in the non-ischemic hemisphere, the ischemic border of rats in vehicle and AUDA treatment groups. Scale bar: 100 μm. (C) Statistical analysis of HO-1+/Iba-1+ in microglia and HO-1+/NeuN+ in neuronal cells in the ischemic border expressed as cells/mm2 n=3/group. (D) The mRNA expression of NeuN in the ischemic cortex, n=4/group. Data are presented as mean ± SEM. *P<0.05.
Abbreviations: AUDA, 12-(3-adamantan-1-yl-ureido)-dodecanoic acid; HO-1, heme oxygenase-1; Iba-1, ionized calcium binding adaptor molecule 1; MCAO, middle cerebral artery occlusion; NeuN, neuronal nuclei; sEH, soluble epoxide hydrolase; SEM, standard error of the mean; SOD-1, superoxide dismutase-1.
Abbreviations: AUDA, 12-(3-adamantan-1-yl-ureido)-dodecanoic acid; HO-1, heme oxygenase-1; Iba-1, ionized calcium binding adaptor molecule 1; MCAO, middle cerebral artery occlusion; NeuN, neuronal nuclei; sEH, soluble epoxide hydrolase; SEM, standard error of the mean; SOD-1, superoxide dismutase-1.
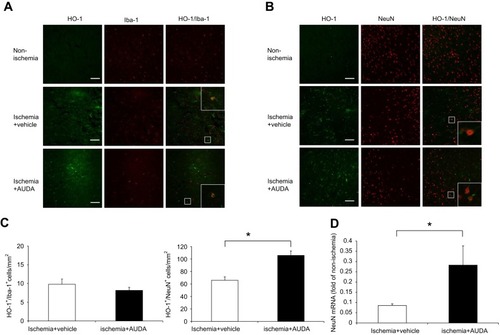
Table S1 The detected target gene primers