
Figures & data
Figure 1 Consort flow diagram.
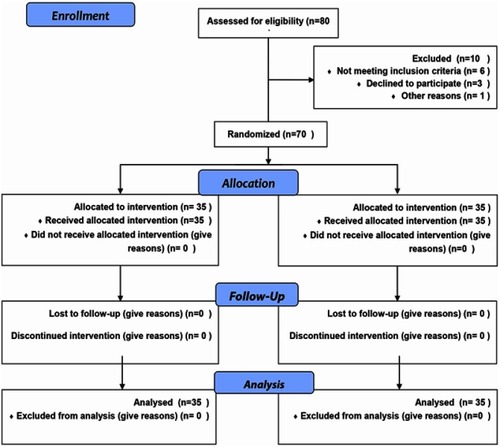
Table 1 Comparison of the demographic characteristics of the participants in the experimental and control group
Table 2 Between- and within-groups comparisonof mean scores (standard deviation in brackets) of the experimental and control groups at pre- and post-test for the BSSI