Figures & data
Table 1 Comparisons of demographic and clinical symptom scores between two groups
Figure 1 Topographical maps of the absolute and relative powers in patients with gambling addiction. Scales show the uV2 for absolute power and the % for relative power. Red represents higher values, and blue represents lower values. The left topography denotes the topographical distribution of the z-score of electroencephalogram power. The right topography denotes the topographical distribution of p-values between group 1 and group 2 (Independent t-test).
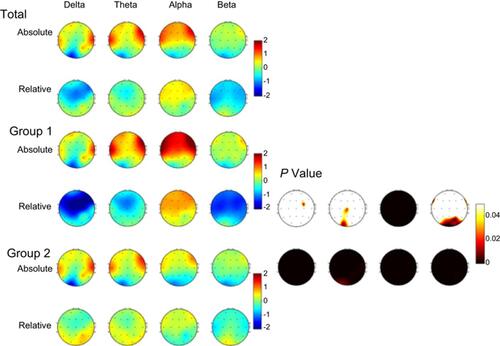
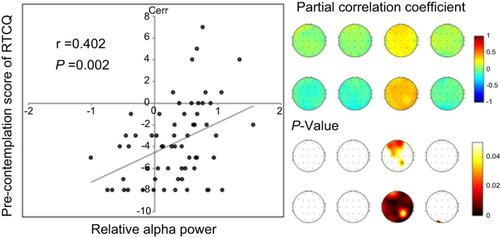
Figure 2 Scatter plots of the Pearson’s partial correlation analysis controlled for age, education, BDI and BAI between z-score of relative alpha power and pre-contemplation score of RTCQ.
Abbreviations: BDI, Beck Depression Inventory; BAI, Beck Anxiety Inventory; RTCQ, Readiness To Change Questionnaire.