Figures & data
Figure 1 Establishment of EAP model. (A) The design of experiment 1. (B) Chronic pelvic pain was assessed by testing tactile allodynia in the control group and EAP group. (C) Hematoxylin and eosin staining of the prostate. Inflammatory cell infiltration (arrow) and vascular congestion (arrowhead) were observed in the EAP group. Scale bar is 20 µm. (D) Mean inflammation score of mice in the two groups. ***p<0.001, vs Control.
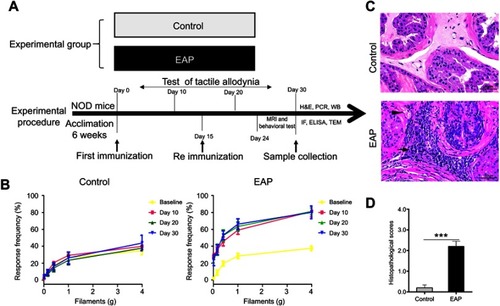
Figure 2 EAP induces depression-like behavior in mice. (A) Schematic illustration and representative track plots of mice during the OFT. (B) Distance in the center, time in the center, mean speed, and rearing number in the OFT. (C) Schematic illustration and representative track plots of mice during the EPM test. (D) Open arm time, percentages of open arm time, open arm entries, and percentages of open arm entries in the EPM test. (E) Time spent immobile in the FST. (F) Time spent immobile in the TST. *p<0.05, **p<0.01, and ***p<0.001, vs Control.
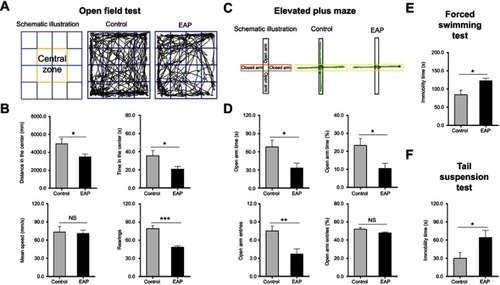
Figure 3 EAP increases the expression of microglial and astrocytic markers in the hippocampus. (A) Immunofluorescence staining of CA1, CA3, and DG regions in the hippocampus. Iba1 (green), GFAP (red), DAPI (blue); scale bar is 50 µm. White arrow and arrowheads show resting microglia and activated microglia respectively. (B) Qualification of Iba-1-positive cells and the percentages of GFAP-stained areas in the CA1, CA3, and DG regions in the hippocampus. (C) Western blot analysis of Iba-1 and GFAP. *p<0.05, **p<0.01, and ***p<0.001, vs Control.
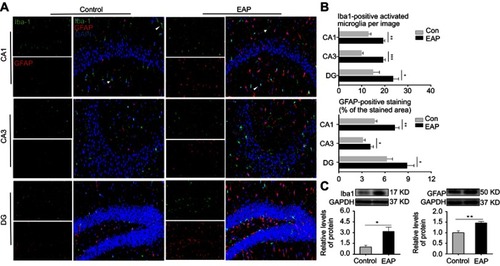
Figure 4 Ultrastructural changes in hippocampal glial cells. (A) TEM observation shows a normal appearance of microglial cells with a primary lysosome (hollow arrow) in the control group. (B) Microglia activation in the EAP group was evidenced by increased and enlarged lysosomes (hollow arrow) in the cytoplasm. (C) Quantitative analysis of the number of lysosomes in the cytoplasm of microglia. (D) The control group showed normal astrocyte morphology with a few mitochondria (arrows) in the cytoplasm. (E) Reactive astrocytosis characterized by increased cytoplasmic Golgi body (arrowheads), endoplasmic reticulum (hollow arrows), and mitochondria (arrows) in the EAP group. (F) Quantitative analysis of the number of organelles in the cytoplasm of microglia. Scale bar is 200 nm. **p<0.01, and ***p<0.001, vs Control.
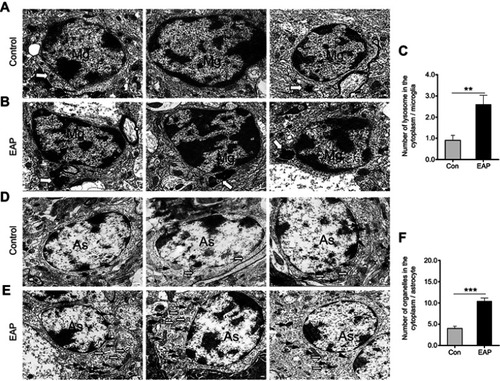
Figure 5 Detection of cytokine changes in the hippocampus of control and EAP mice. (A–E) Real-time PCR analysis of TNF-α, IL-1β, IL-6, IL-8, and IL-18. *p<0.05, **p<0.01, vs Control.
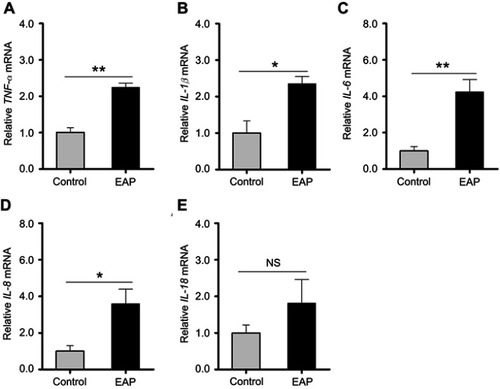
Figure 6 EAP causes increased concentrations of serotonin in the hippocampus of EAP mice. (A) Real-time PCR analysis of SLC6A4 and IDO. (B) ELISA analysis of serum serotonin. (C) Correlations between serum serotonin concentrations and behavioral measurements. r, Pearson correlation coefficient. *p<0.05, vs Control.
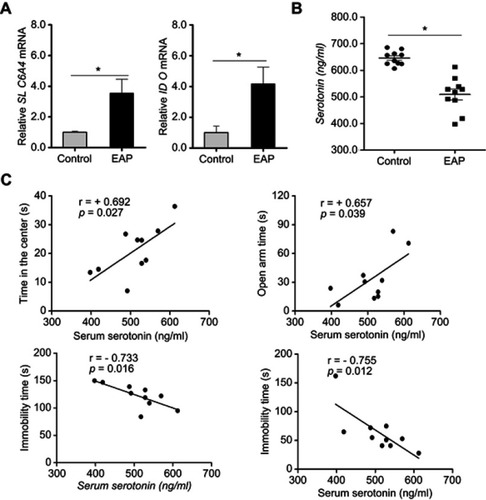
Figure 7 Neurochemical changes in the hippocampus of EAP mice. (A) MRI anatomic images of the brain in mice. The white boxes indicate the placement of the volume of interest. (B) Representative in vivo 1H-MRS. (C) Comparisons of metabolite ratios (Glx/tCr and Tau/tCr) between control and EAP mice in the hippocampus. *p<0.05, vs Control.
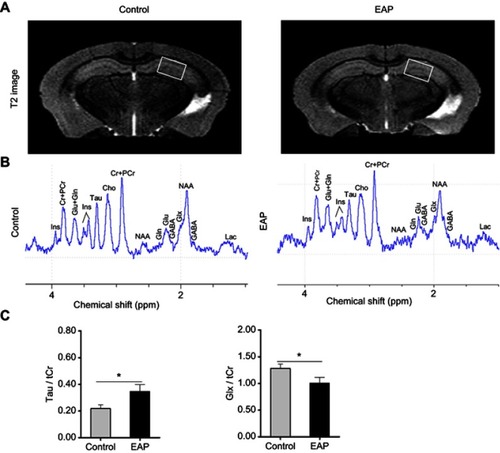
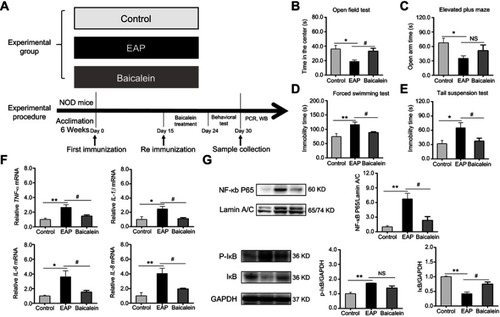
Figure 8 Baicalein treatment reverses EAP-induced depressive-like behavior and neuroinflammation via the NF-κB pathway. (A) The design of experiment 2. (B) Time in the center of the OFT. (C) Open arm time in the EPM. (D) Immobility time in the FST. (E) Immobility time in the TST. (F) PCR analysis of TNF-α, IL-1β, IL-6, and IL-8. (G) Western blot analysis of NF-κB p65, p-IκB, and IκB. *p<0.05, **p<0.01, vs Control. #p<0.05, vs EAP.