
Figures & data
Table 1 Patient demographic data
Figure 1 Correlation of 25(OH)D levels with YGTSS scores. Associations between 25(OH)D levels and YGTSS scores in the whole CTDs group (n=120) at baseline were analyzed via Pearson’s correlation test. (A) Total YGTSS score correlation with 25(OH)D levels. (B) Total YGTSS tic score correlation with 25(OH)D.
Abbreviations: 25(OH)D, 25-hydroxyvitamin D; YGTSS, Yale Global Tic Severity Scale; CTDs, chronic tic disorders.
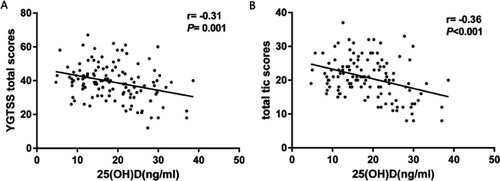
Table 2 Follow-up treatment in children with CTDs and vitamin D deficiency or insufficiency
Table 3 Rating scores and 25(OH)D levels in children that have CTDs before and after vitamin D3 supplementation