
Figures & data
Table 1 Clinical Profile Of Patients Recruited For iTRAQ Experiments
Table 2 Demographic Profile Of Patients Recruited For ELISA
Table 3 Identification Of Proteins That Show Differential Expression Across The Clinical Dopaminergic Spectrum
Table 4 Identified Proteins, Their Interactions And Implications In Dopaminergic Pathways
Figure 1 Proteins identified in the CSF of Parkinson’s disease, neurological controls and schizophrenia patients. The total numbers and their respective percentages are shown.
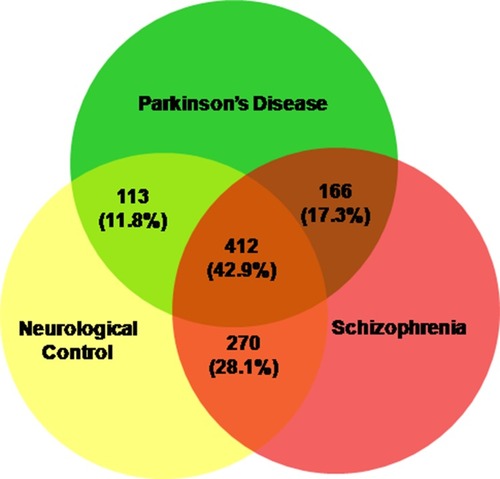
Figure 2 Graphical representation of the biological annotation and molecular function of identified proteins. (A) Pie chart representations in Parkinson’s disease, neurological control and schizophrenia patients. (B) Pie chart representations in Parkinson’s disease, neurological control and schizophrenia patients.
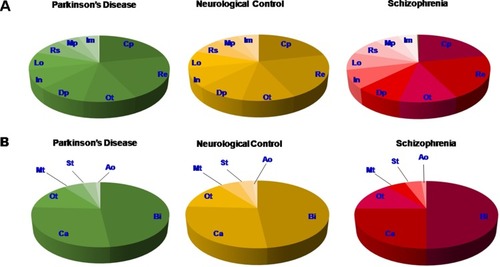
Figure 3 Graphical depiction of protein expression with respect to dopamine concentration in the brain. (A) Protein expressions that are inversely related to the dopamine spectrum comprising Parkinson’s disease, neurological control and schizophrenia patients. (a) Alpha-2-macroglobulin, (b) apolipoprotein C-III, (c) IGL@ protein, (d) complement C3, (e) melanoma cell adhesion molecule, (f) complement factor I light chain, and (g) IgG Fc-binding protein. (B) Protein expressions that are directly related to the dopamine spectrum comprising Parkinson’s disease, neurological control and schizophrenia patients. (h) Insulin-like growth factor 2, (i) apolipoprotein D, and (j) ectonucleotide pyrophosphatase/phosphodiesterase family member 2. Diagrammatic representation of the dopamine concentration in cerebrospinal fluid is shown along the x-axis.Citation73,Citation74
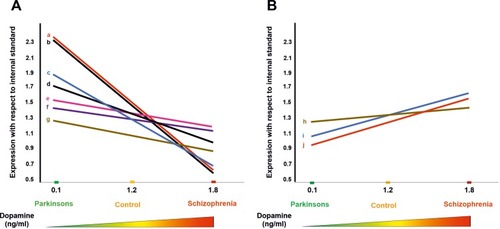
Figure 4 Pathway analysis shows the identified proteins and their respective interactions. The identified proteins are shown in white nodes, interacting nodes in Parkinson’s disease pathway are highlighted in green, interacting nodes in the schizophrenia pathway are highlighted in red, and nodes that are common to both groups are highlighted in yellow. Direct interacting nodes are indicated by thick-bordered nodes. Interactions of the identified proteins are shown by grey lines.
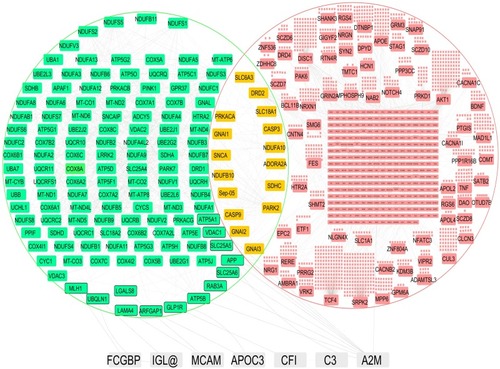
Table 5 Pearson’s Correlation Between α2M Concentrations And Age, Gender And Disease Duration
Table 6 Pharmaco-Therapeutic Monitoring Value Of CSF α-2-Macroglobulin In Parkinson’s Disease And Schizophrenia
Figure 5 ELISA for the expression of alpha-2-macroglobulin in the CSF of schizophrenia patients, neurological controls and Parkinson’s disease patients. Mean ± standard error of mean of the values are shown by horizontal lines. The bars represent the concentrations as the average of duplicate readings of each patient sample. The trend line across the three phenotypes is shown as a blue dotted line (y = −0.43x+ 1.58; correlation coefficient: R2 = 0.99). Diagrammatic representation of the dopamine concentration in cerebrospinal fluid is shown along the x-axis.Citation73,Citation74 ***Indicates statistical significance with P<0.001.
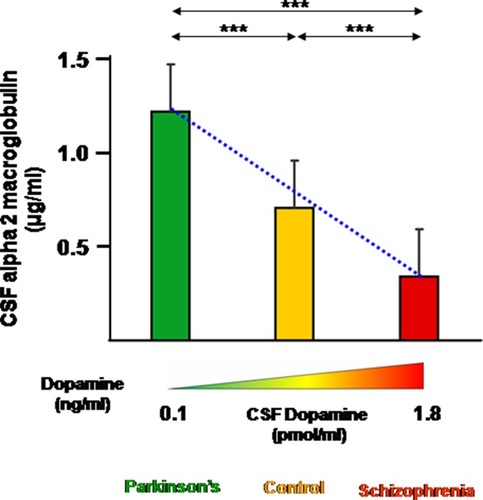
Table 7 Protein Biomarkers In CSF With Potential Use In Neurological Diseases