Figures & data
Figure 1 Study flow chart with exclusion criteria.
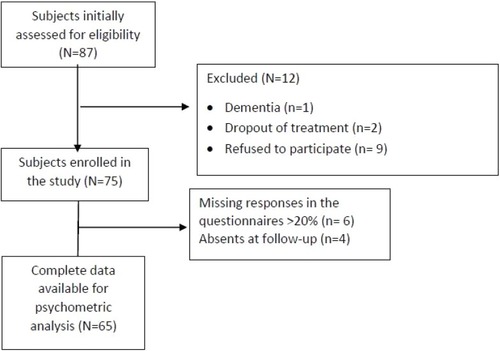
Table 1 Sociodemographic And Clinical Characteristics Of The Total Sample (n=65)
Table 2 Changes In Median Scores Of Cognitive And Metacognitive Scales Pre (T0) And Post (T1) Rehabilitation
Table 3 Changes In Mean Scores Of Psychological Scales Pre (T0) And Post (T1) Rehabilitation
Table 4 Correlations Of DERS Total Score And Subscales With Psychological, Cognitive And Metacognitive Factors At Admission
Figure 2 Box-plot of difficulties in “Emotional clarity” between abstinent or not subject at one month from discharge.
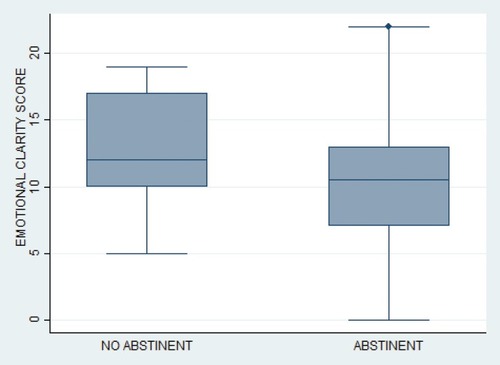
Figure 3 Box-plot of difficulties in “Emotional clarity” between subjects with low (PACS score ≤15) and high craving (PACS score >15) at discharge.
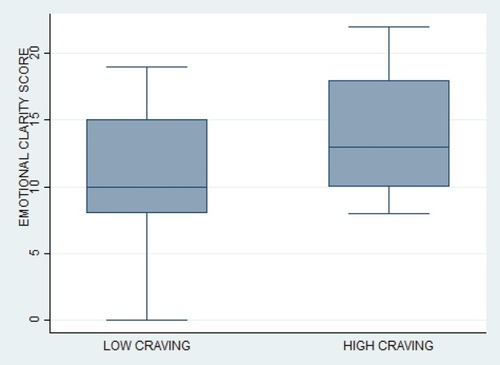
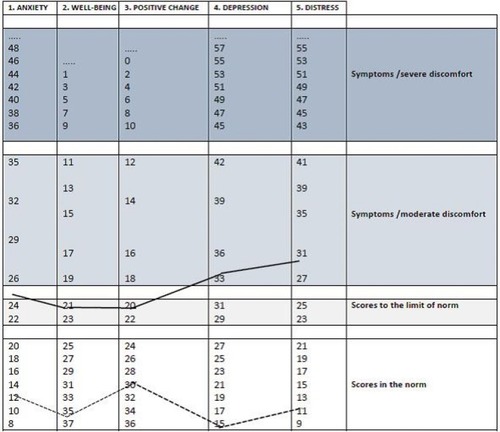
Figure 4 Clinical profile of psychological variables: T0 (admission); T1 (discharge).