Figures & data
Figure 1 The chemical structure of galuteolin and the experimental process. (A) Schematic diagram of the chemical structure of galuteolin (C21H20O11, molecular weight: 448.38). (B) Flow chart of the establishment of rat MCAO/R model.
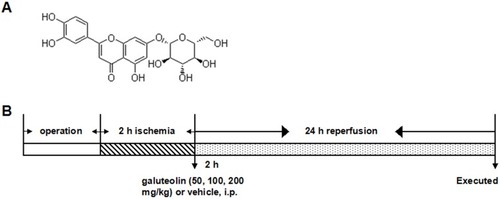
Figure 2 Effects of galuteolin on cerebral infarction volume, neural behavior, and cerebral water content after CIRI in rats. Effects of galuteolin on cerebral infarction volume (A, B), neural behavior, (C) and cerebral water content, and (D) after MCAO/R injury in rats.
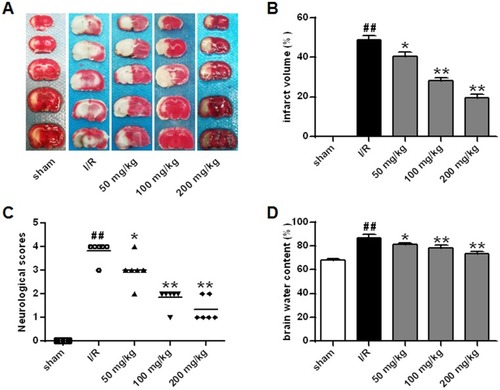
Figure 3 Detection of the effect of galuteolin on neuronal apoptosis by TUNEL staining. (A) Images of TUNEL staining in rat brain tissue from each group. (B) TUNEL positive cells in the rat brain tissue of each group.
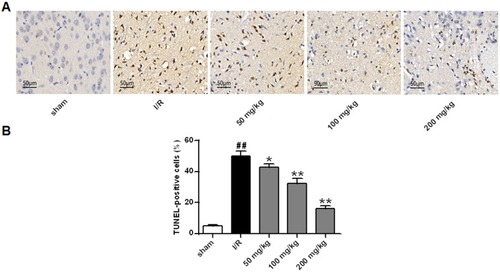
Figure 4 Effects of galuteolin on apoptosis-related proteins in rat cerebral infarction tissues. (A) Determination of the protein expressions of Bcl-2, Bax, and caspase-3 in cerebral infarction tissues of rats by Western Blot. (B) Histogram of BCL-2 protein expression. (C) Histogram of protein expression of Bax. (D) Histogram of caspase-3 protein expression. The β-actin as a standard internal reference.
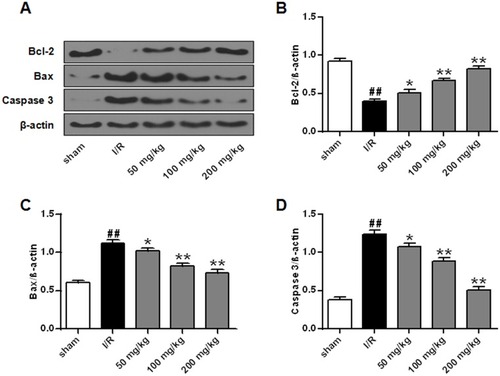
Figure 5 Effects of galuteolin on Akt phosphorylation in rat cerebral infarction tissues. (A) Determination of the expressions of p-Akt and Akt in rat cerebral infarction by Western Blot. (B) Histogram of p-AktAkt protein expressions. The β-actin as a standard internal reference.
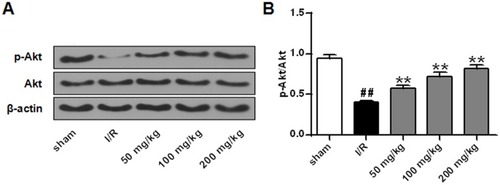
Figure 6 Effects of galuteolin on oxidative stress in cerebral infarction of rats. (A) Determination of the level of LPO in rat brain tissue by LPO kit. (B) Determination of the expression levels of Sod1, Sod2, and catalase by Western Blot. (C) Histogram of Sod1 protein expression. (D) Histogram of Sod2 protein expression. (E) Histogram of catalase protein expression. The β-actin as a standard internal reference.
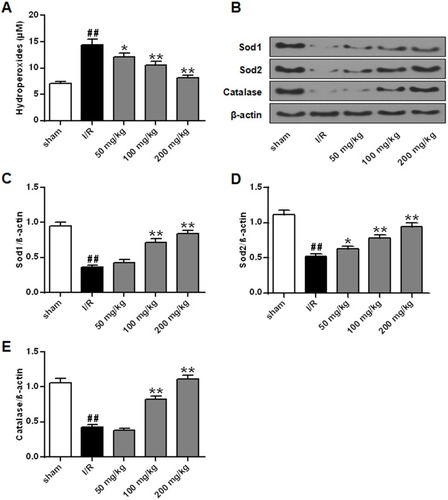
Figure 7 Effects of galuteolin on inflammatory responses in rat cerebral infarction. (A) Determination of the secretion of pro-inflammatory cytokine TNF-α in cerebral infarction by ELISA. (B) Determination of the secretion of pro-inflammatory cytokine IL-1β in cerebral infarction by ELISA.
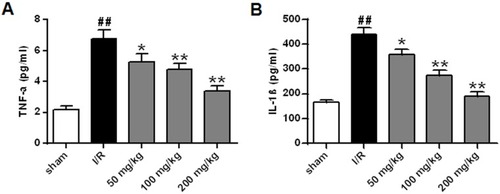
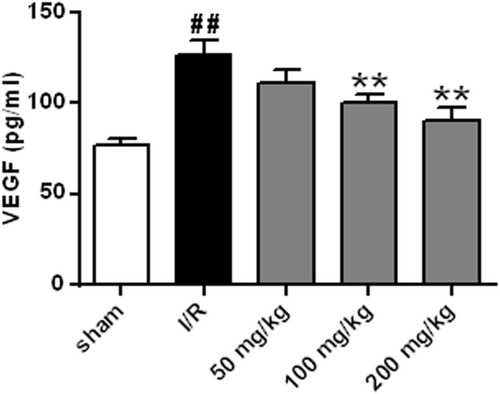
Figure 8 Effect of galuteolin on VEGF level in cerebral infarction tissue of rats. Notes: n=6, compared with the I/R group p, **P<0.01; compared with the sham group, ## P<0.01.