Figures & data
Table 1 Primer Sequences for Real-Time Quantitative Polymerase Chain Reaction
Table 2 Primer Sequences for Hybridization in situ
Figure 1 BBB score of each group before treatment and on the 14th days. ① P< 0.01, ② P<0.05 versus sham; ③ P<0.01, ④ P<0.05 versus SCI; ⑤ P<0.01; ⑥ P<0.05 versus EA; ⑦ P<0.01; ⑧P<0.05 versus Y27632. Data are expressed as the mean±SD (1-way analysis of variance and Student-Newman-Keuls post hoc test, n=8 rats/group).
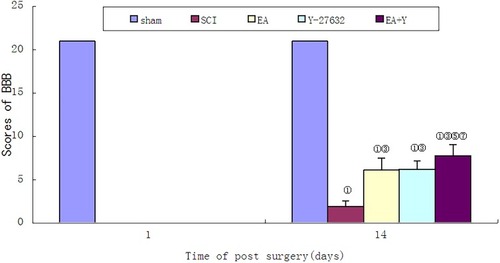
Figure 2 Nogo-A, NgR and LINGO-1 activation following SCI. (A) Western blotting bands for Nogo-A, NgR and LINGO-1. Compiled results in a bar graph for the relative protein expression (B) of Nogo-A. (C) of NgR. (D) of LINGO-1. ① P < 0.01, ② P<0.05 versus sham. ③ P<0.01, ④ P<0.05 versus SCI. Data are shown as the mean±standard error of the mean (1-way analysis of variance and Student-Newman-Keuls post hoc test, n=4 rats/group).
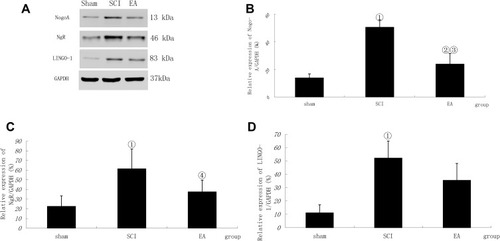
Figure 3 Comparison of the mRNA relative expression of Nogo-A, NgR and LINGO-1. Compiled results in a bar graph for the relative mRNA expression (A) of Nogo-A. (B) of NgR. (C) of LINGO-1. ① P < 0.01, ② P<0.05 versus sham. ③ P<0.01. Data are shown as the mean±standard error of the mean (1-way analysis of variance and Student-Newman-Keuls post hoc test, n=4 rats/group).
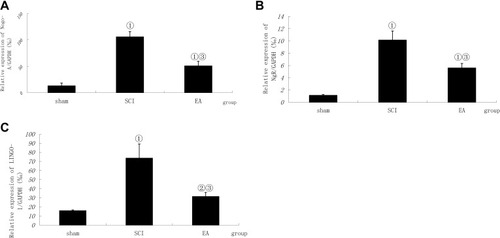
Figure 4 MLCP, ROCK II and RhoA activation following SCI. (A) Western blotting bands for MLCP, ROCK II, RhoA and GAPDH expression. Compiled results in a bar graph for the ratio (B) of MLCP/GAPDH expression. (C) of ROCK II/GAPDH expression. (D) of RhoA/GAPDH expression. ① P<0.01, ② P<0.05 versus sham. ③ P<0.01, ④ P<0.05 versus SCI. ⑥ P<0.05 versus EA. ⑦ P<0.01, ⑧P<0.05 versus Y27632. Data are shown as the mean±standard error of the mean (1-way analysis of variance and Student-Newman-Keuls post hoc test, n=4 rats/group).
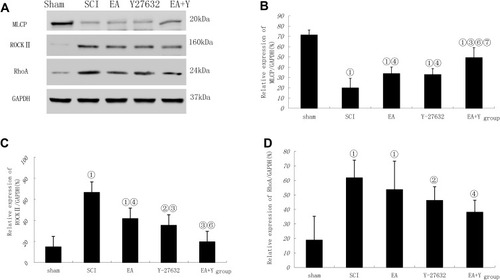
Figure 5 Effect of electroacupuncture on changes in mRNA expression of MLCP, ROCK II and RhoA in injured spinal cords. (A) Compiled results in a bar graph for MLCP expression. Compiled results in a bar graph (B) for ROCK II expression. (C) for RhoA expression.① P<0.01,. ③ P<0.01. ⑤ P<0.01; ⑥ P<0.05 versus EA. ⑦ P<0.01 versus Y27632. Data are expressed as the mean±SD (1-way analysis of variance and Student-Newman-Keuls post hoc test, n=4 rats/group).
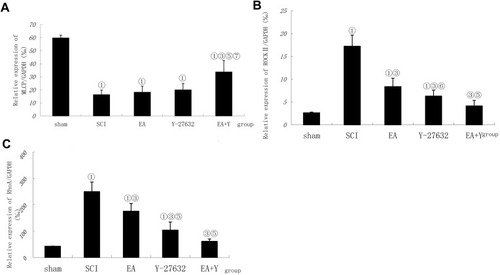
Figure 6 Myosin phosphatase target subunit 1 (MYPT1) activation following SCI. (A) Western blotting bands for phosphorylated MYPT1 (p-MYPT1), MYPT1, and GAPDH expression. Compiled results in a bar graph for the ratio (B) of p-MYPT1/GAPDH expression. (C) of MYPT1/GAPDH expression. (D) of p-MYPT1/MYPT1. ① p<0.01, ② P<0.05 versus sham. ③ P<0.01, ⑥ P<0.05 versus EA. Data are shown as the mean±standard error of the mean (1-way analysis of variance and Student-Newman-Keuls post hoc test, n=4 rats/group). sham: sham operation.
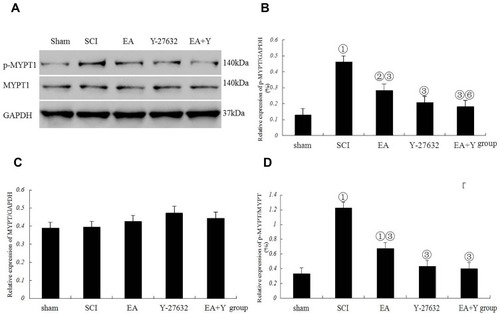
Figure 7 mRNA expression of caspase3 in injured spinal cords at 14 days following treatment (in situ hybridization, ×400). (Bar =25 µm).
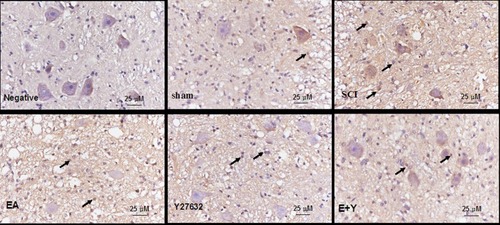
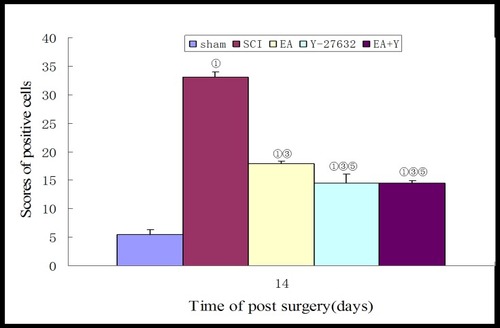
Figure 8 Compiled results in a bar graph for the number of caspase3 mRNA-positive cells. ① P<0.01. ③ P<0.01. ⑤ P<0.01 versus EA. Data are expressed as the mean±SD (1-way analysis of variance and Student-Newman-Keuls post hoc test, n=4 rats/group).