
Figures & data
Table 1 Demographic Data, Health Condition, And Self-Reported Inventory Of Patients With Breast Cancer (N = 145)
Figure 1 Scatter plots with a regression line of the correlations between post-traumatic stress symptoms and post-traumatic growth.
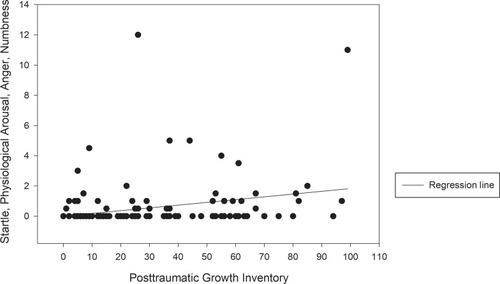
Table 2 Summary Of The Linear Regression Of Significant Predictors For PTGI In Patients With Breast Cancer
Table 3 Summary Of The Linear Regression Of Significant Predictors For PTSD In Patients With Breast Cancer