Figures & data
Table 1 Descriptive Characteristics Of The Sample Subgroups
Table 2 Diffusivity Measures And Volumes Of The Investigated Tracts
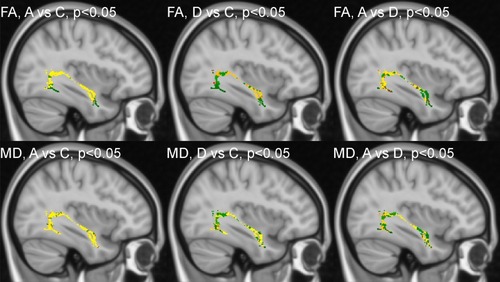
Figure 1 Tract-Based spatial statistics for the left inferior longitudinal fasciculus. Voxels without differences between the two groups are in green. Voxels with the most significant differences between the two groups are coded using a red-to-yellow color map.
Abbreviations: FA, fractional anisotropy; MD, mean diffusivity; A, autism spectrum disorders; D, developmental dysphasia; C, healthy controls.