Figures & data
Table 1 Demographics And Clinical Characteristics Of The Subjects
Table 2 Differences In VMHC Between The AD, AND, And HC Groups In The Typical Frequency Band
Figure 1 The main effect of group (addiction) on the typical frequency band (GRF correction, voxel-level p<0.01 and cluster-level p<0.05). The cool color indicates brain regions with decreased VMHC, and the warm color indicates brain regions with increased VMHC. The left side of the picture represents the left side of the brain.
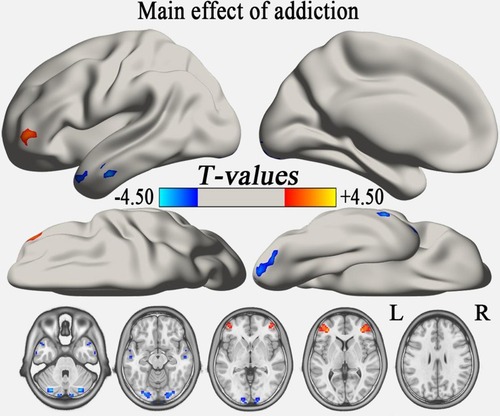
Figure 2 (A) The VMHC differences between individuals with AD and HCs in the typical band (GRF correction, voxel-level p<0.01 and cluster-level p<0.05). (B) The VMHC differences between individuals with AND and HCs in the typical band (p<0.01, uncorrected). The hot color indicates that individuals with AD or AND had a significantly higher VMHC value compared to HCs, while the cool color indicates the opposite. The left side of the figure is the left side of the brain.
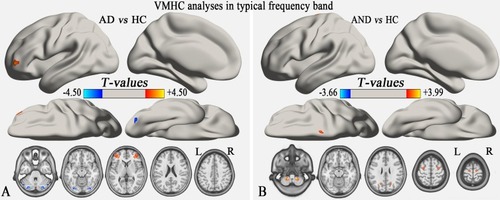
Table 3 Differences In VMHC In The Slow-5 And Slow-4 Frequency Bands Between Groups
Figure 3 Group comparison of the VMHC in the slow-5 and slow-4 frequency bands. (A) and (B) show the group differences in slow-5 frequency band (p<0.01, uncorrected). (C) and (D) show the group differences in the slow-4 frequency band. In (C) GRF correction was applied at a voxel level of p<0.01 and cluster-level p<0.05, while (D) was uncorrected with p<0.01. The cool color indicates brain regions with decreased VMHC, and the warm color indicates brain regions with increased VMHC in the comparison between individuals with AD (or AND) and HCs.
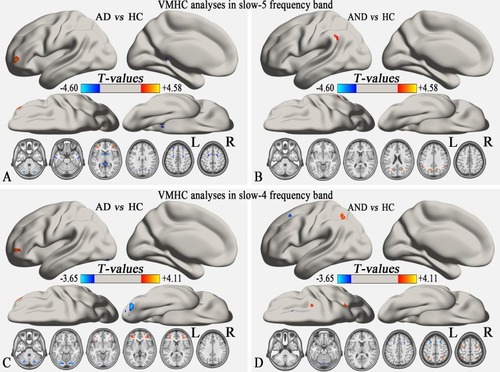
Figure 4 Alterations of the FC between seeds that exhibited altered VMHC in group comparison (shown in ) and whole brain voxels in the typical frequency band (GRF correction, voxel-level p<0.01 and cluster-level p<0.05). All seeds show a similar positive connectivity pattern in individuals with AD and HCs. The cool color indicates decreased seed-based FC in individuals with AD compared to HCs, while the warm color indicates increased seed-based FC.
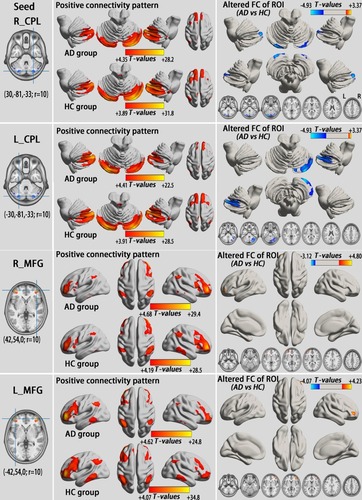
Figure 5 Alterations of the FC between seeds that exhibited altered VMHC in the group comparison (shown in ) and whole brain voxels in the slow-4 band (GRF correction, voxel level p<0.01 and cluster-level p<0.05). All seeds show a similar positive connectivity pattern in individuals with AD and HCs. The cool color indicates decreased seed-based FC in individuals with AD compared to HCs, while the warm color indicates increased seed-based FC.
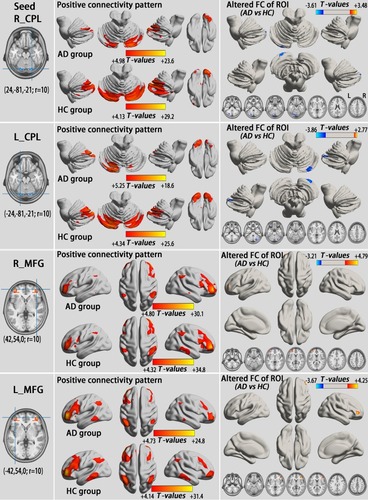
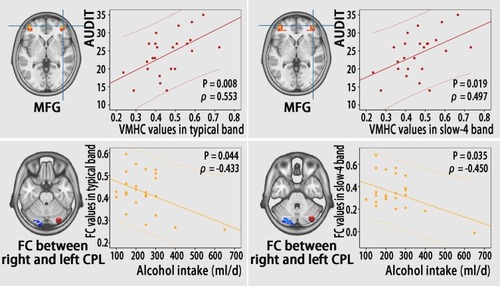
Figure 6 Correlations between functional results (VMHC and FC) and clinical variables (AUDIT score and alcohol intake) in individuals with AD.