
Figures & data
Table 1 Subjects Data
Figure 1 VOIs in the VSRAD® software program. (A) VOI in medial temporal lobe structures. (B) VOI in the dorsal brain stem.
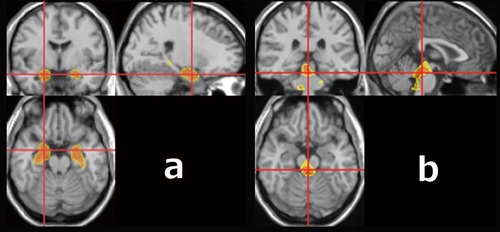
Table 2 Comparison Of Single Index Values For Characterizing Atrophy In The Target VOIs Between DLB And AD
Table 3 Discrimination Performance Of DLB And AD Using Single Indices
Table 4 Discrimination Performance Of DLB And AD Using Multiple Indices
Figure 2 Decision tree for differentiation of DLB and AD using VBM results in the training data set. Below each node, the numbers of AD (left) and DLB (right) patients are shown. The class of AD or DLB as the classification result is shown at the center of each node. In this decision tree, the condition classified as DLB corresponds to the terminal node on the right end, and “MTL_Z <2.185 and DBS_Z_white_ratio ≥0.195 and DBS_Z_gray_ratio” is the cutoff.
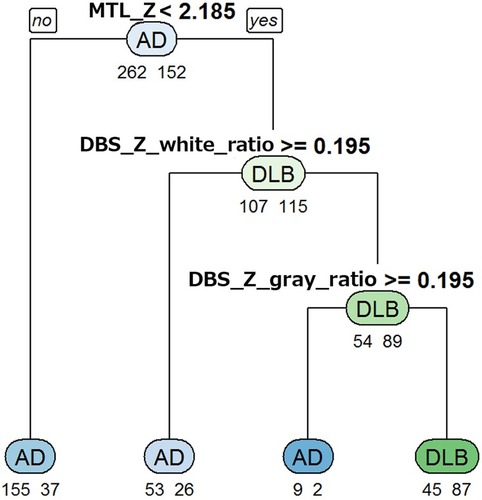
Table 5 Association Of Single Index Values With Core Clinical Features In DLB