
Figures & data
Table 1 Characteristics Of Study At The Baseline
Figure 1 The flowchart of study sample selection from National Health Insurance Research Database in Taiwan.
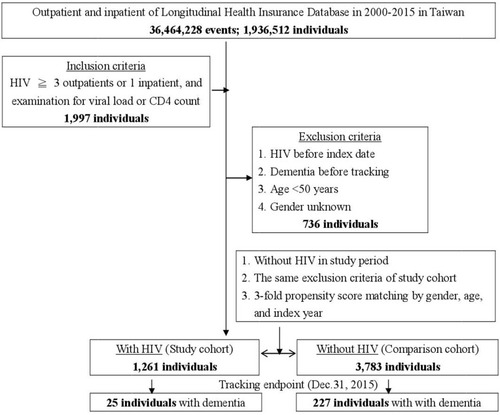
Table 2 Factors Of Dementia By Using Cox Regression And Fine & Gray’s Competing Risk Model
Table 3 Factors Of Dementia Subgroup By Using Cox Regression And Fine & Gray’s Competing Risk Model
Figure 2 Kaplan–Meier for cumulative incidence of dementia aged 50 and over stratified by HIV with log rank test.
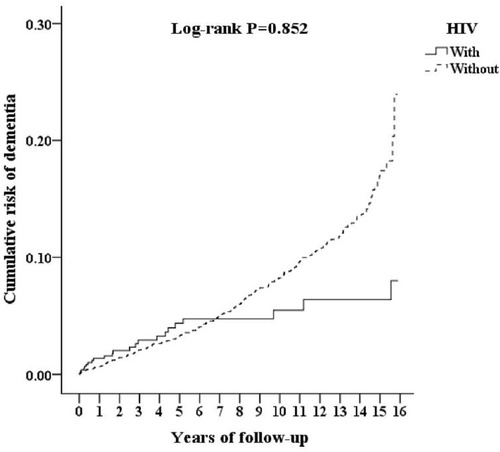
Figure 3 Kaplan–Meier for cumulative incidence of dementia aged 50 and over stratified by HAART users and non-users with log rank test.
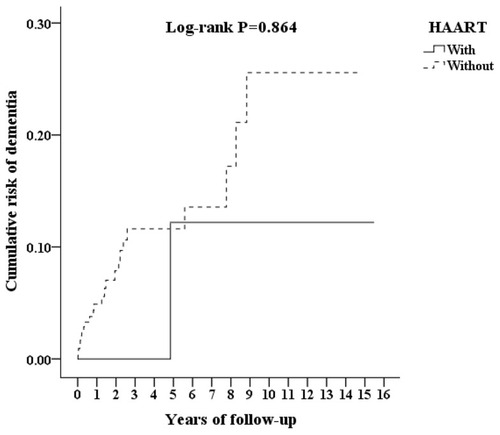
Table 4 Factors Of Dementia Subgroup Among HIV Cohort By Using Cox Regression And Fine & Gray’s Competing Risk Model