
Figures & data
Table 1 Characteristics of HC and ADD Participants
Figure 1 (A–D) Resistance and pulsatility indices middle cerebral artery.
Abbreviations: RI, resistance index; PI, pulsatility index; MCA, middle cerebral artery; HC, healthy controls; ADD, Alzheimer’s disease dementia.
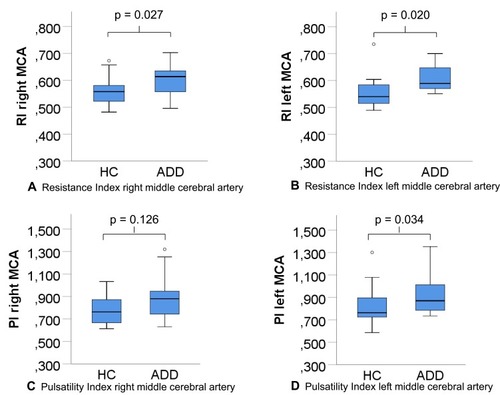
Table 2 ROC Analyses for RI and PI of the Right and Left MCA
Table 3 ROC Analyses for Clustered Data of RI and PI of the MCA
Figure 2 (A, B) ROC analyses for clustered data.
Abbreviations: ADD, Alzheimer’s disease dementia; HC, healthy controls; AUC, area under the curve; RI, resistance index; PI, pulsatility index; MCA, middle cerebral artery.
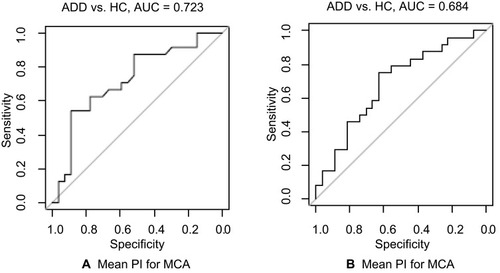
Table 4 Spearman Correlation Analyses Between the CDR SOB and the RI and PI for All Participants
Table 5 Minimal Sample Size Calculation