Figures & data
Figure 1 Flowchart of the study selection process.
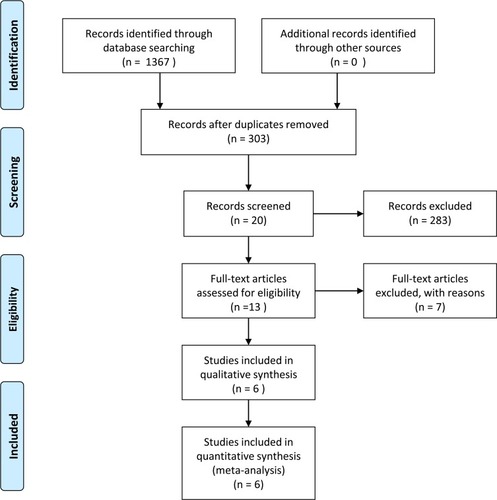
Table 1 Quality Assessment Scores of the Included Studies
Table 2 Overview of Included Studies
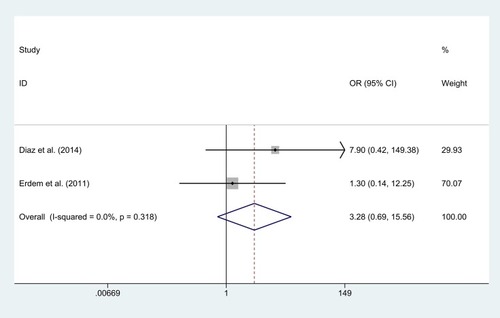
Figure 2 Forest plot of odds ratio (OR) of retreatment with endovascular coiling vs. surgical clipping.
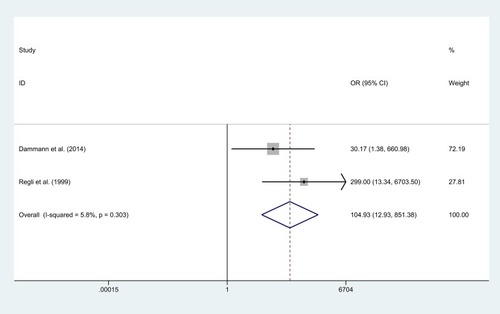
Figure 3 Forest plot of rate difference (RD) of postoperative death with endovascular coiling vs. surgical clipping.
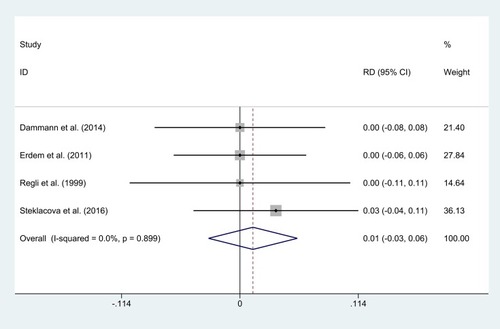
Figure 4 Forest plot of odds ratio (OR) of postoperative completed occlusion with endovascular coiling vs. surgical clipping.
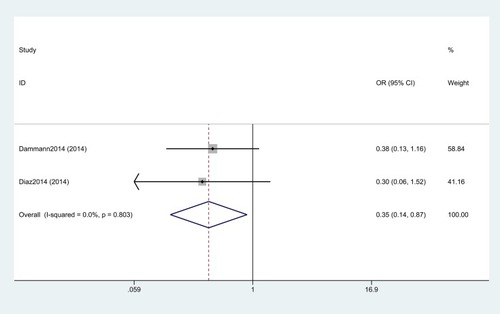
Figure 5 Forest plot of odds ratio (OR) of postoperative surgical complication with endovascular coiling vs. surgical clipping.
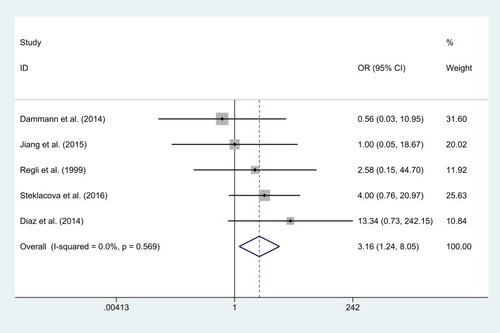
Figure 6 Forest plot of odds ratio (OR) of postoperative thrombus without infarction with endovascular coiling vs. surgical clipping.
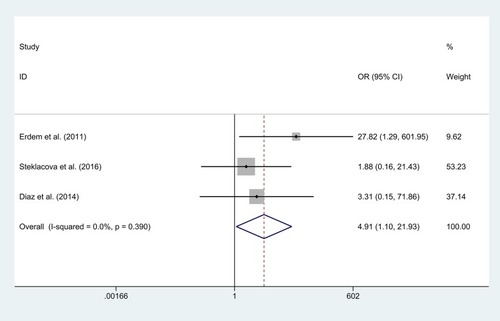
Table 3 Meta-Analysis Results
Figure 7 Forest plot of odds ratio (OR) of postoperative Glasgow Outcome Scale (GOS) with endovascular coiling vs. surgical clipping.
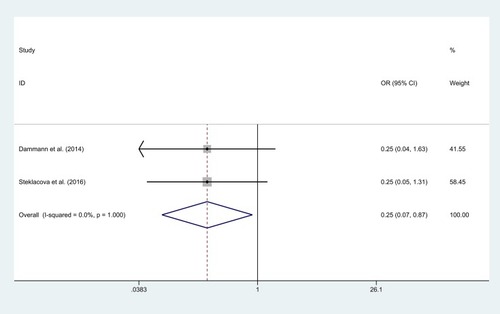
Figure 8 Forest plot of odds ratio (OR) of postoperative modified Rankin scale (mRS) with endovascular coiling vs. surgical clipping.