Figures & data
Table 1 Detailed Clinical Data of Each Patient with DR
Table 2 The Connection Strength of Brain Networks and Its P-Value Among Different Brain Regions Between Healthy Controls and DR Patients
Table 3 The Connection Strength of Brain Networks and Its P-Value Among Different Brain Regions Between Healthy Controls and DR Patients
Figure 1 Twelve nodes. The connection strength of brain networks among these nodes significantly decreases more in the patient group than in the control group. The line thickness between nodes indicates the strength of the computed measure on the respective link, quantified with marked number.
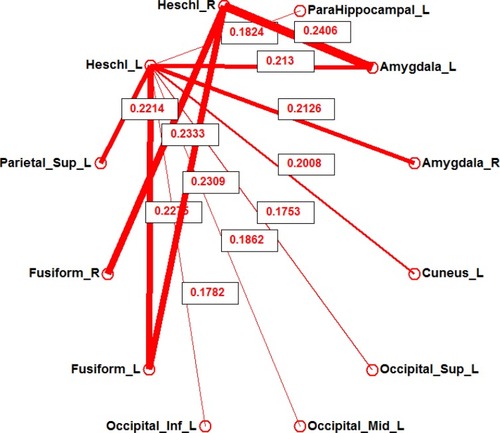
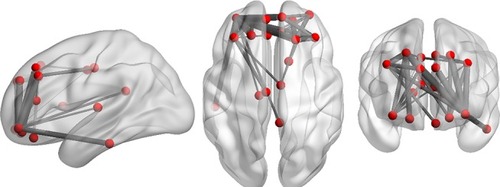
Figure 2 Three-dimensioned views by BrainNet Viewer; respectively, sagittal, axial, and coronal views, showing the same nodes as in .
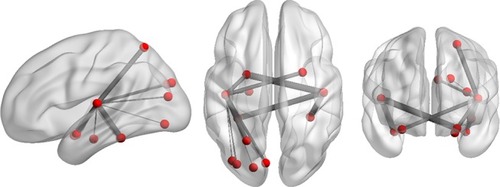
Figure 3 Nineteen nodes. The connection strength of brain networks among these nodes significantly increases more in the patient group than in the control group. The line thickness between nodes indicates the strength of the computed measure on the respective link, quantified with marked number.
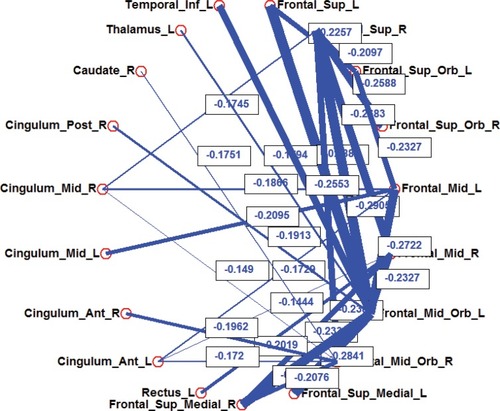
Figure 4 Three-dimensioned views by BrainNet Viewer; respectively, sagittal, axial, and coronal view, showing the same nodes as in .