Figures & data
Figure 1 Effects of CIG on behavioral deficits in MCAO rats.
Notes: (A) Neurological deficit scores were evaluated by the mNSS test. (B) Time to walk across the whole beam in the beam walking test. (C) Adhesive removal time in the somatosensory test. (D) Recognition index in the object recognition test. Data are expressed as the mean ± SEM, n=10 each group. #P<0.05, ##P<0.01, ###P<0.001, model group vs sham control group; *P<0.05, **P<0.01, ***P<0.001, drug-treated groups vs model group.
Abbreviations: CIG, cornel iridoid glycoside; MCAO, middle cerebral artery occlusion; mNSS, modified neurological severity scores; SEM, standard error of mean; CIG-L, CIG 60 mg/kg; CIG-H, CIG 120 mg/kg; EGB, the extract of Ginkgo biloba 12 mg/kg.
Abbreviations: CIG, cornel iridoid glycoside; MCAO, middle cerebral artery occlusion; mNSS, modified neurological severity scores; SEM, standard error of mean; CIG-L, CIG 60 mg/kg; CIG-H, CIG 120 mg/kg; EGB, the extract of Ginkgo biloba 12 mg/kg.
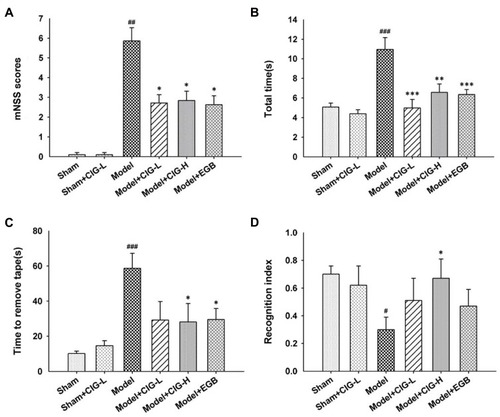
Figure 2 Effects of CIG on white matter lesions in the corpus callosum of MCAO rats measured by LFB staining.
Notes: (A) Representative images of brain sections stained with LFB (scale bar = 1000 μm). (B) Quantification of the grading scores for LFB-stained sections. Data are expressed as mean ± SEM, n = 3 each group. ##P<0.01, model group vs sham control group; *P<0.05, drug-treated groups vs model group.
Abbreviations: CIG, cornel iridoid glycoside; MCAO, middle cerebral artery occlusion; LFB, Luxol fast blue; SEM, standard error of mean; CIG-L, CIG 60 mg/kg; CIG-H, CIG 120 mg/kg; EGB, the extract of Ginkgo biloba 12 mg/kg.
Abbreviations: CIG, cornel iridoid glycoside; MCAO, middle cerebral artery occlusion; LFB, Luxol fast blue; SEM, standard error of mean; CIG-L, CIG 60 mg/kg; CIG-H, CIG 120 mg/kg; EGB, the extract of Ginkgo biloba 12 mg/kg.
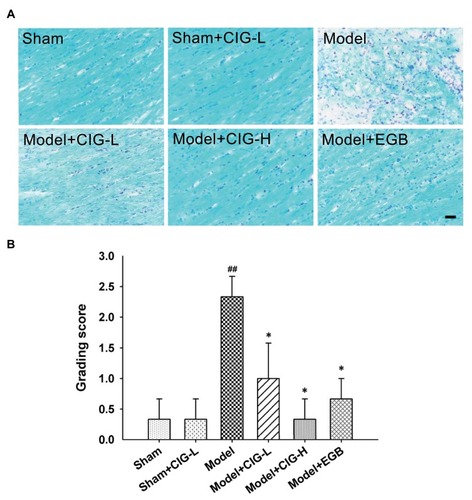
Figure 3 Effects of CIG on the ultrastructure of myelin sheaths and myelinated axons in the corpus callosum of MCAO rats evaluated by transmission electron microscopy.
Notes: (A) Representative images of the ultrastructure of myelin sheaths and myelinated axons. Red arrows show myelin swelling and demyelination. (B) Quantification of the ratio of demyelinated axons to total axons. Data are expressed as mean ± SEM, n = 3 each group. ###P<0.001, model group vs sham control group; ***P<0.001, drug-treated groups vs model group.
Abbreviations: CIG, cornel iridoid glycoside; MCAO, middle cerebral artery occlusion; SEM, standard error of mean; CIG-L, CIG 60 mg/kg; CIG-H, CIG 120 mg/kg; EGB, the extract of Ginkgo biloba 12 mg/kg.
Abbreviations: CIG, cornel iridoid glycoside; MCAO, middle cerebral artery occlusion; SEM, standard error of mean; CIG-L, CIG 60 mg/kg; CIG-H, CIG 120 mg/kg; EGB, the extract of Ginkgo biloba 12 mg/kg.
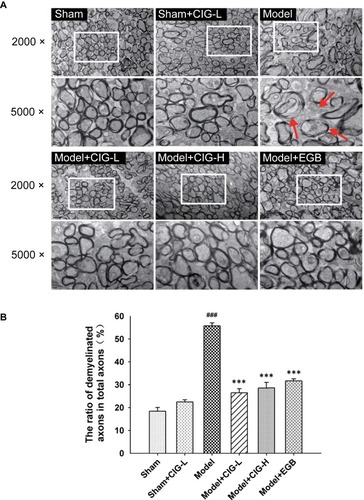
Figure 4 Effects of CIG on MBP expression and the number of mature oligodendrocytes in the corpus callosum of MCAO rats.
Notes: (A) Representative images of MBP immunohistochemistry. Scale bar = 500 µm. (B) Western blot images of MBP expression. (C) Quantitative analysis of MBP expression from the Western blot images. β-Actin served as an internal loading control. (D) Representative images of APC-labeled mature oligodendrocytes. Scale bar = 1000 µm. (E) Quantitative analysis of the number of APC-positive cells. Data are expressed as mean ± SEM, n = 3 each group. #P<0.05, ###P<0.001, model group vs sham control group; *P<0.05, ***P<0.001, drug-treated groups vs model group.
Abbreviations: CIG, cornel iridoid glycoside; MBP, myelin basic protein; MCAO, middle cerebral artery occlusion; SEM, standard error of mean; CIG-L, CIG 60 mg/kg; CIG-H, CIG 120 mg/kg; EGB, the extract of Ginkgo biloba 12 mg/kg.
Abbreviations: CIG, cornel iridoid glycoside; MBP, myelin basic protein; MCAO, middle cerebral artery occlusion; SEM, standard error of mean; CIG-L, CIG 60 mg/kg; CIG-H, CIG 120 mg/kg; EGB, the extract of Ginkgo biloba 12 mg/kg.
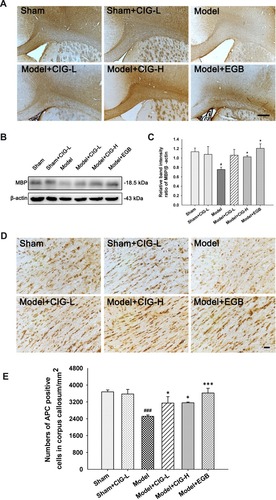
Figure 5 Effects of CIG on activated microglia and astrocytes in the corpus callosum of MCAO rats.
Notes: (A) Representative images of Iba1-labeled microglia. Scale bar = 1000 µm. (B) Representative images of GFAP-labeled astrocytes. Scale bar = 1000 µm. (C) Quantitative analysis of the number of Iba1-positive cells. (D) Quantitative analysis of the number of GFAP-positive cells. Data are expressed as mean ± SEM, n = 3 each group. #P<0.05, ###P<0.001, model group vs sham control group; *P<0.05, ***P<0.001, drug-treated groups vs model group.
Abbreviations: CIG, cornel iridoid glycoside; MCAO, middle cerebral artery occlusion; GFAP, glial fibrillary acidic protein; SEM, standard error of mean; CIG-L, CIG 60 mg/kg; CIG-H, CIG 120 mg/kg; EGB, the extract of Ginkgo biloba 12 mg/kg.
Abbreviations: CIG, cornel iridoid glycoside; MCAO, middle cerebral artery occlusion; GFAP, glial fibrillary acidic protein; SEM, standard error of mean; CIG-L, CIG 60 mg/kg; CIG-H, CIG 120 mg/kg; EGB, the extract of Ginkgo biloba 12 mg/kg.
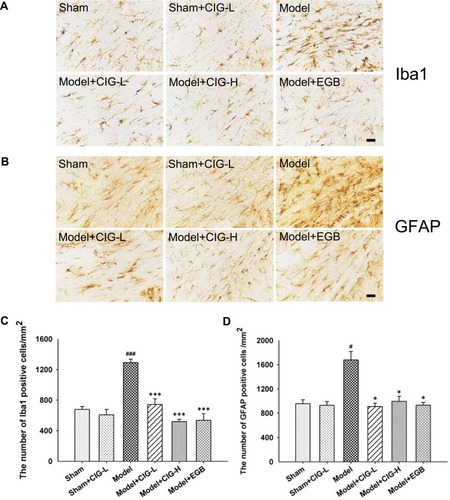
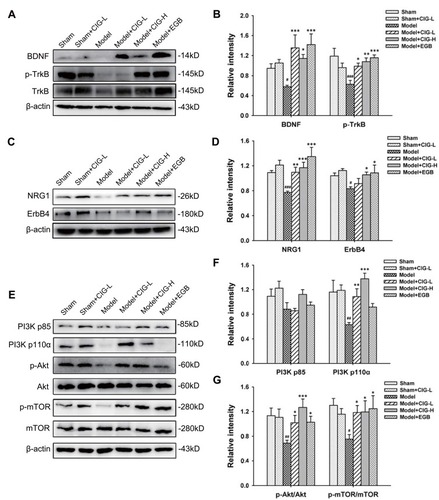
Figure 6 Effects of CIG on BDNF/TrkB, NRG/ErbB, and PI3K/Akt/mTOR pathways in the corpus callosum of MCAO rats.
Notes: (A) Representative Western blot images of BDNF, phosphorylated (p)-TrkB, and total TrkB. (B) The relative intensity of BDNF and p-TrkB. (C) Representative Western blot images of NRG1 and ErbB4. (D) The relative intensity of NRG1 and ErbB4. (E) Representative Western blot images of PI3K subunits p85 and p110α, p-Akt and total Akt, and p-mTOR and total mTOR. (F) The relative intensity of PI3K subunits p85 and p110α. (G) The relative intensity of p-Akt/Akt and p-mTOR/mTOR. β-Actin was used as an internal loading control. Data are expressed as mean ± SEM, n = 3 each group. #P<0.05, ##P<0.01, ###P<0.001, model group vs sham control group; *P<0.05, **P<0.01, ***P<0.001, drug-treated groups vs model group.
Abbreviations: CIG, cornel iridoid glycoside; BDNF, brain-derived neurotrophic factor; NRG, neuregulin; MCAO, middle cerebral artery occlusion; mTOR, mammalian target of rapamycin; PI3K, phosphatidylinositol 3-kinase; SEM, standard error of mean; CIG-L, CIG 60 mg/kg; CIG-H, CIG 120 mg/kg; EGB, the extract of Ginkgo biloba 12 mg/kg.
Abbreviations: CIG, cornel iridoid glycoside; BDNF, brain-derived neurotrophic factor; NRG, neuregulin; MCAO, middle cerebral artery occlusion; mTOR, mammalian target of rapamycin; PI3K, phosphatidylinositol 3-kinase; SEM, standard error of mean; CIG-L, CIG 60 mg/kg; CIG-H, CIG 120 mg/kg; EGB, the extract of Ginkgo biloba 12 mg/kg.