93
Views
11
CrossRef citations to date
0
Altmetric
Original Research

Thromboelastography with Platelet Mapping Detects Platelet Dysfunction in Patients with Aneurysmal Subarachnoid Hemorrhage with Rebleeding

, , , , , , , & show all
Pages 3443-3451 | Published online: 16 Dec 2019

Figures & data

Figure 1 Explanation of TEG and TEG-PM. (A) TEG parameters: K, Angle, MA, EPL and LY30. (B), TEG-PM parameters: MAThrombin, MAADP/AA, and MAFibrin. R, reaction time to clot formation; K, clotting time until 20-mm amplitude is achieved; Angle, time to reach a maximum speed of initial clot formation.

Abbreviations: MA, maximum amplitude; EPL, percent of clot lysis 30 mins after MA; LY30, percent of amplitude decay 30 mins after MA; AA, arachidonic acid; ADP, adenosine diphosphate.
Figure 1 Explanation of TEG and TEG-PM. (A) TEG parameters: K, Angle, MA, EPL and LY30. (B), TEG-PM parameters: MAThrombin, MAADP/AA, and MAFibrin. R, reaction time to clot formation; K, clotting time until 20-mm amplitude is achieved; Angle, time to reach a maximum speed of initial clot formation.

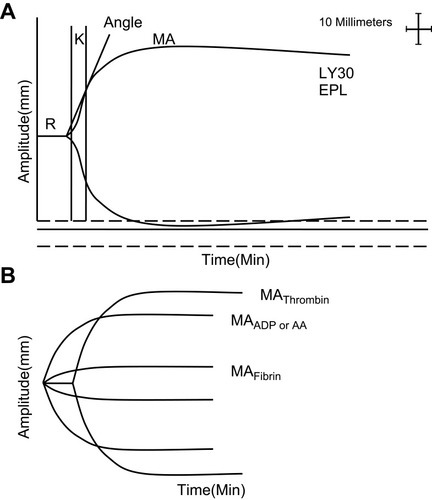
Table 1 Patient Characteristics

Table 2 Platelet Count and TEG-PM Parameters in Controls and Subarachnoid Hemorrhage Patients Stratified by Neurological Severity

Figure 2 Scatter plots showing the correlations between the degree of pathway inhibition and clinical grades. (A) AA inhibition was significantly correlated with Fisher grade (Spearman’s r=0.169, P=0.008); (B) ADP inhibition was significantly correlated with Fisher grade (Spearman’s r=0.233, P<0.001); (C) AA inhibition was significantly correlated with Hunt–Hess grade (Spearman’s r=0.264, P<0.001); (D) ADP inhibition was significantly correlated with Hunt–Hess grade (Spearman’s r=0.183, P=0.004).

Abbreviation: AA, arachidonic acid; ADP, adenosine diphosphate.
Figure 2 Scatter plots showing the correlations between the degree of pathway inhibition and clinical grades. (A) AA inhibition was significantly correlated with Fisher grade (Spearman’s r=0.169, P=0.008); (B) ADP inhibition was significantly correlated with Fisher grade (Spearman’s r=0.233, P<0.001); (C) AA inhibition was significantly correlated with Hunt–Hess grade (Spearman’s r=0.264, P<0.001); (D) ADP inhibition was significantly correlated with Hunt–Hess grade (Spearman’s r=0.183, P=0.004).

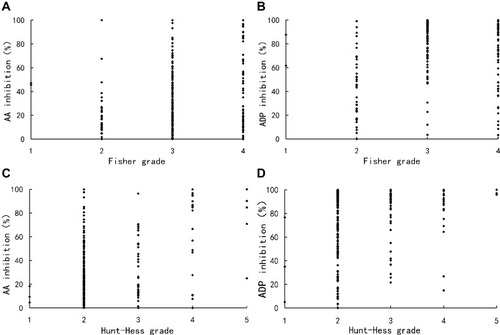
Table 3 Comparison of Baseline Demographic, Clinical Characteristics and TEG-PM Parameters Between Patients with and Without Rebleeding

Table 4 Multivariate Analysis for Risk Factors of Rebleeding