Figures & data
Figure 1 The results of depressive behaviors. (A) The results of source water test; (B) the results of open-field test. *P<0.05 comparing with sham+saline group. #P<0.05 comparing with HF+GBE group.
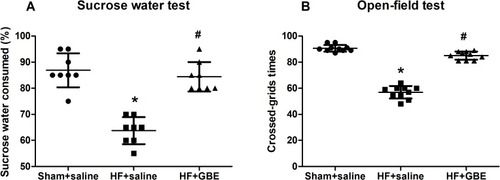
Figure 2 The concentration of 5-HT and 5-HT2AR in cerebral cortex and hippocampus. (A) The level of 5-HT in cerebral cortex. (B) The level of 5-HT in hippocampus. (C) The level of 5-HT2AR in cerebral cortex. (D) The level of 5-HT2AR in hippocampus. All the proteins were detected by ELISA. *P<0.05 comparing with sham+saline group. #P<0.05 comparing with HF+GBE group.
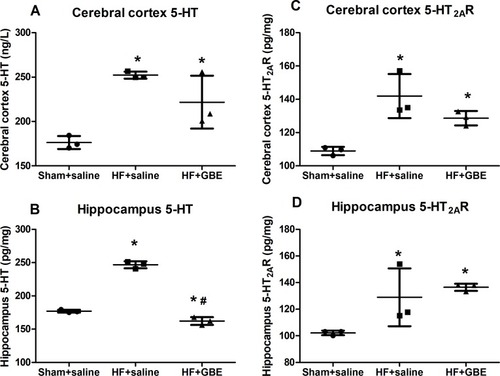
Figure 3 The response of inflammation. (A) The concentration of TNF-αand IL-1β in hippocampus detected by WB, and GAPDH as loading control. (B) The expression of TNF-α and IL-1β in hippocampus by immunohistochemistry, and the magnification was 100 times the original size. Red arrows indicate examples of the expression of related cytokines.
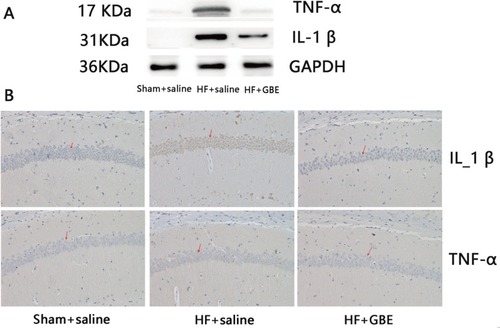
Figure 4 The cardiac function. (A) The value of LVEF by echocardiography. (B) The level of BNP by ELISA. (C) The myocardial section in Masson’s staining, and the magnification was 5 times the original size. *P<0.05 comparing with sham+saline group. #P<0.05 comparing with HF+GBE group.
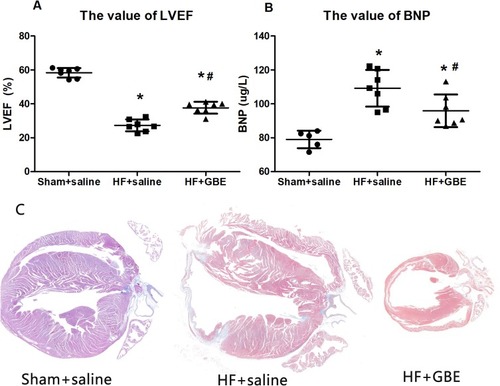
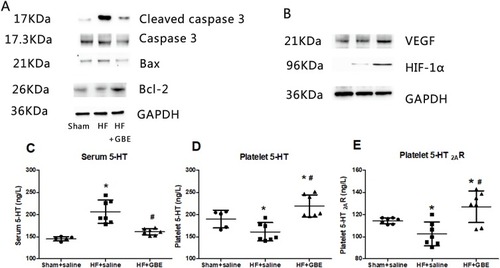
Figure 5 The anti-apoptotic function and 5-HT system regulation of GBE. (A) The expression of cleaved caspase-3, caspase-3, Bax, Bcl-2 detected by WB. (B) The expression of VEGF, HIF-1α. GAPDH was used as a loading control. (C) The level of 5-HT in serum by ELISA. (D) The level of 5-HT in platelet by ELISA. (E) The level of 5-HT2AR in platelet by ELISA. *P<0.05 comparing with sham+saline group. #P<0.05 comparing with HF+GBE group.