Figures & data
Figure 1 A structural model pathway for mediating the role of SOC in the relationship of type C personality and depression. a: The relationship between type C personality and SOC; b: The relationship between SOC and depression; c: The relationship between type C personality and depression; c’: The relationship between type C personality and depression after adopting SOC as a mediator.
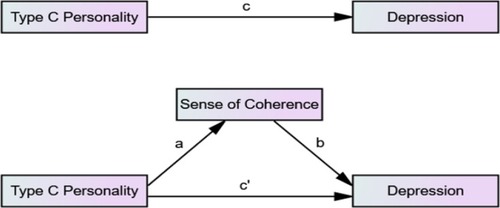
Table 1 Demographic Characteristics of the Participants (N = 575)
Table 2 Correlation Between Main Variables of CB, SOC and HAMD (N = 575)
Table 3 Results of Multiple Linear Regression Analysis (Enter Method) (N = 575)
Table 4 The Goodness-of-Fit Indices of the SEM (N = 575)
Table 5 The Standardized Total, Indirect, and Direct Effects Among Type C Personality, SOC and Depression (N = 575)
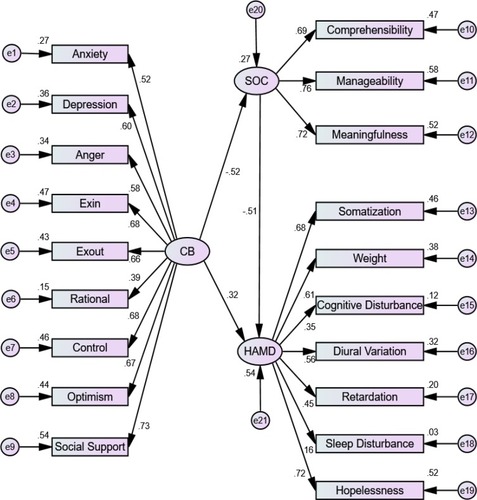
Figure 2 Pathway coefficients of the SEM (N = 575).