
Figures & data
Table 1 Epidemiologic and Clinical Characteristics in ASD Cases and Controls
Table 2 Genotype Distributions and Allele Frequencies of the 677C>T Rs1801133 and 1298A>C Rs1801131 SNPs in ASD Cases and Controls (Crude and Adjusted by Age)
Table 3 Genotype Distributions and Allele Frequencies of the 677C>T Rs1801133 and 1298A>C Rs1801131 SNPs in ASD Patients According to CARS Scores (Adjusted by Age)
Figure 1 Genotypic distributions of the 677C>T rs1801133 and 1298A>C rs1801131 SNPs in cases with CARS scores <37 and ≥37.
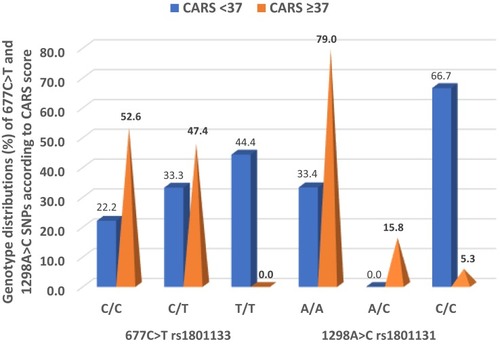
Table 4 Co-Segregation of Combined Genotypes of the MTHFR 677C>T Rs1801133 and MTHFR 1298A>C Rs1801131
Table 5 Haplotype Association of the MTHFR 677C>T Rs1801133 and MTHFR 1298A>C Rs1801131 SNPs with Response to Study Groups (Adjusted by Age)
Table 6 Linkage Disequilibrium Analysis of MTHFR 677C>T Rs1801133 and MTHFR 1298A>C Rs1801131 SNPs
Table 7 Correlation Between SNP Genotypes and Allelic Frequencies of MTHFR 677C>T and ASD Among Different Ethnic Populations
Table 8 Correlation Between SNP Genotypes and Allelic Frequencies of MTHFR 1298A>C and ASD Among Different Ethnic Populations