Figures & data
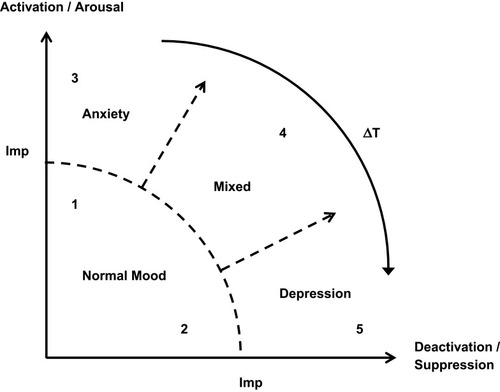
Figure 1 Phase diagram showing stress outcomes from the resolution of biological drives.
Notes: Imp=impairment (clinically significant symptoms begin above this line), Mixed=area of mixed clinical anxiety and clinical depression, ∆T=passage of time (indicating unresolved stress moves from anxiety to depression). Examples of locations of mood states:1=Excited, 2=Relaxed, 3=Panic and phobia (prominent hyperarousal), 4=Melancholic depression, 5= Atypical depression (prominent neurovegetative symptoms).