
Figures & data
Figure 1 Flowchart of selection process of drivers surviving road traffic crashes in southwest Ethiopia, 2019 (n=398).
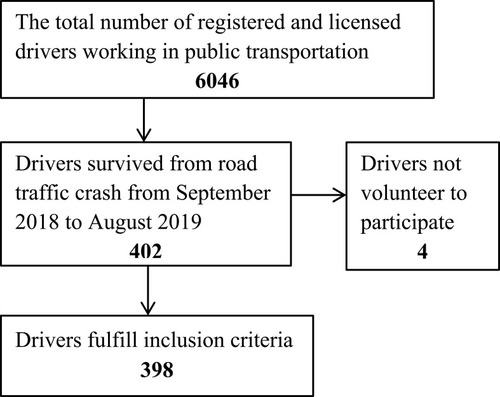
Table 1 Sociodemographic and Economic Characteristics of Drivers Surviving Road Traffic Crashes in Southwest Ethiopia, 2019 (n=398)
Table 2 Accident-related and Clinical Factors Among Drivers Surviving Road Traffic Crashes (RTCs) in Southwest Ethiopia, 2019 (n=398)
Table 3 Substance-use Risk Among Drivers Surviving Road Traffic Crash in Southwest Ethiopia, 2019 (n=398)
Figure 2 Prevalence of posttraumatic stress–disorder symptoms using Trauma Screening Questionnaire among drivers surviving road traffic crash in southwest Ethiopia, 2019 (n=398).
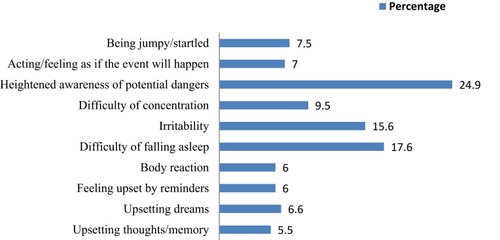
Table 4 Bivariate and Multivariate Analysis of Factors Associated with Posttraumatic Stress Disorder (PTSD) Among Drivers Surviving Road Traffic Crashes (RTCs) in Southwest Ethiopia, 2019 (n=398)