Figures & data
Figure 1 A cartoon illustrating the go/no-go task. ms, millisecond.
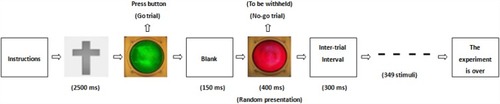
Table 1 Demographic and Clinical Characteristics of Participants
Figure 2 (A) Comparison of RTs for the go trials in the MD and HC group. (B) Comparison of hit rate for go trials in the MD and HC group. (C) Comparison of false alarm rate for the no-go trials in the MD and HC group. *p<0.01; **p<0.001.
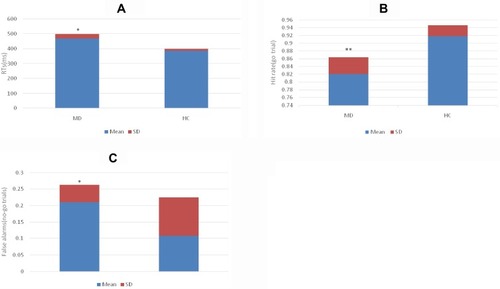
Figure 3 The electrocardio components were collected from the cardiac artifacts within 300 s by manual operation. (A) Raw signal, band pass filtered, filtered with the derivative filter, squared and averaged with 30 samples length (Black – noise, Green – adaptive threshold, Red – sig level, and Red circles – QRS adaptive threshold); (B) QRS on filtered signal, QRS on MVI signal and noise level (black), signal level (red) and adaptive threshold (green), and pulse train of the found QRS on ECG signal; (C) the figure presents segment 30/30, and time from 290 to 299.99 s.
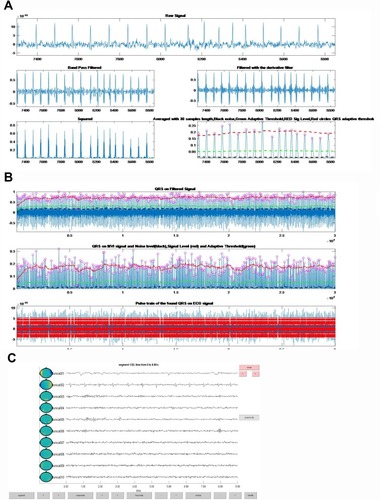
Figure 4 (A) Comparison of RR in the MD and HC group. (B) Comparison of RMSSD in the MD and HC group. (C) Comparison of SDANN in the MD and HC group. *p<0.01.
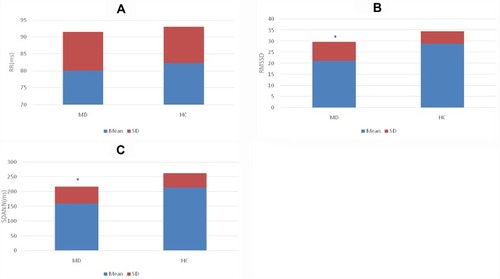
Table 2 Brain Regions for the Whole Brain Connectivity with the Left Superior Frontal Gyrus (Orbital Part) Under No-Go Task (MNI Coordinates)
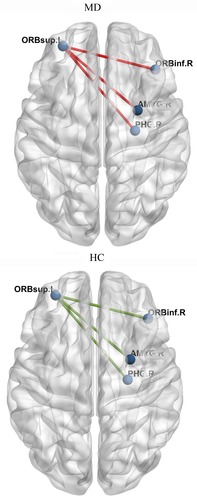
Figure 5 A brain MEG functional connectivity analysis based on seed regions of the orbitofrontal cortex (OFC) showed that, compared to HC group, brain regions involved in the functional connectivity network of OFC in MD group included: the functional connectivity between the left superior frontal gyrus (orbital part) and the right inferior frontal gyrus (orbital part), right amygdale and right parahippocampal gyrus.