Figures & data
Figure 1 Define regions of interest (ROIs). Schematic drawing of infarction and SND area, pink sliver indicate ROIs, the ROIs – cortical columns 0.5 mm in width – were placed perpendicular to the cortical surface which correspond to 5.7 mm left of the midline, where normal tissue developed infarction (right, above), and 2.5 mm left of the midline, where selective neuronal death (right, below) was consistently observed 2 w after ischemia. Bar scale=40 µm.
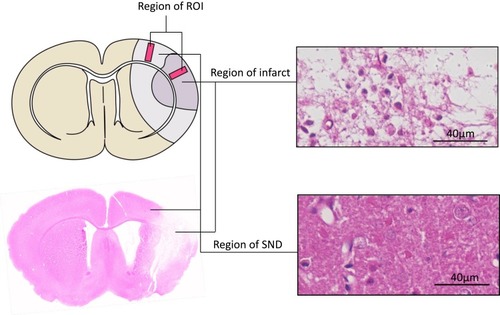
Figure 2 Representative images of immunohistochemical staining of GLAST and GLT-1 glutamate transporters in the ischemic core and periphery regions of the cortex. Both GLAST and GLT-1 were activated at 6 h post-ischemia following a distinct decrease from 12 h in the ischemic core region while GLT-1 levels remained increased at 12 h in the ischemic periphery region. Bar scale= 40 µm.
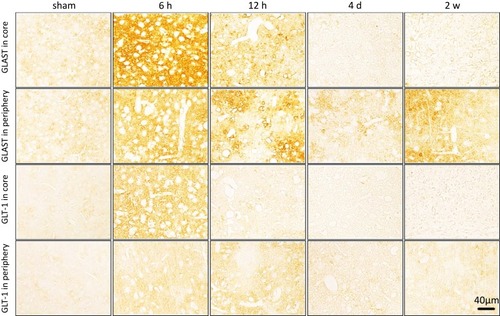
Figure 3 Western blot analysis of GLAST and GLT-1 in the ischemic core (A) and periphery (B) regions of the cortex. Upper rows show representative protein bands for GLAST and GLT-1, and lower rows show the re-probed β-tubulin protein bands. Quantitative analysis of the intensity level of GLAST and GLT-1 protein normalized to β-tubulin peaking at 6 h and decreasing from 12 h to 4 d in the ischemic core (C) and periphery (D) regions of the brain. **P < 0.01, *P < 0.05, compared to sham; #P < 0.05, compared to 6 h.
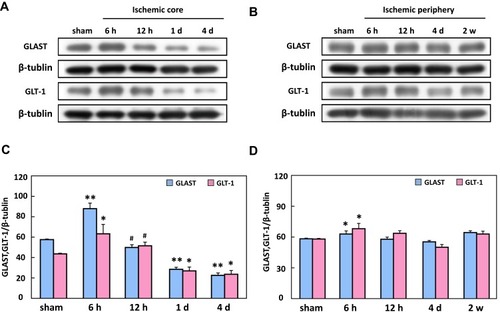
Figure 4 The expression of glutamine synthetase (GS) in the ischemic core and periphery regions of the cortex. (A) Representative immunostaining showed that GS-positive cells (arrows) were significantly increased at 6 h in both the core and periphery. (B) The density of glutamine synthetase peaked at 6 h in the ischemic core and periphery regions. Bar scale = 40 µm. n=20, **P < 0.01, compared to sham.
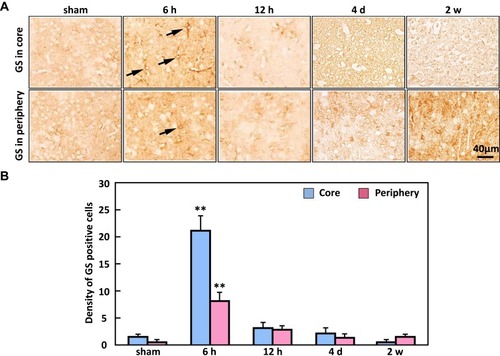
Figure 5 The analysis of Alizarin red-positive cells in the ischemic core and periphery regions of the cortex. (A) Representative images of Alizarin red staining (B) showing the density of calcium-deposited in cells peaked at 12 h in the ischemic core and periphery regions of the brain. Bar scale= 40 µm. **P < 0.01, compared to sham.
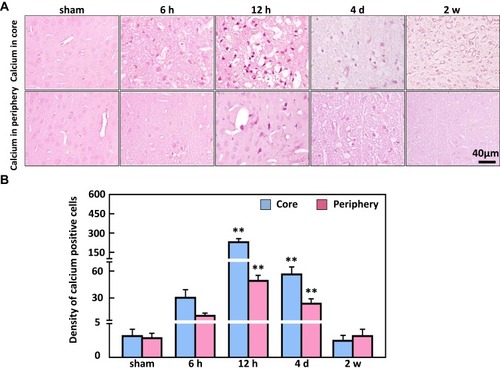
Figure 6 The analysis of NeuN-positive cells in the ischemic core and periphery regions of the cortex. (A) Representative images of NeuN immunohistochemical staining. (B) The density of the NeuN-positive cells significantly decreased first in the ischemic core region from 12 h then decreased from 4 d t in the ischemic periphery region. Bar scale= 40 µm. **P < 0.01, *P < 0.05, compared with sham.
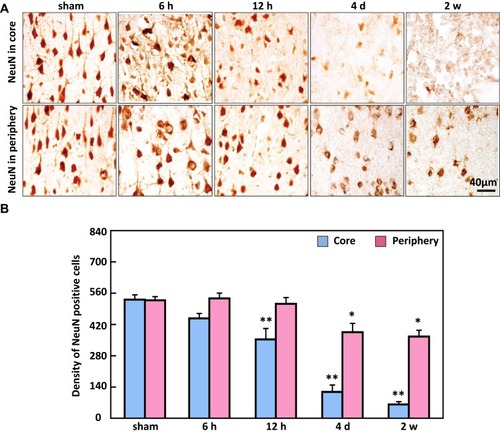
Figure 7 The expression of S100β in the ischemic core and periphery regions of the cortex. (A) Representative images of S100β immunohistochemical staining. (B) The density of S100β-positive cells significantly decreased from 12 h in the ischemic core region while in the ischemic periphery regions S100β staining density significantly increased by 2 w. Arrows show that S100β-positive cells. Bar scale=40 µm. **P < 0.01, *P < 0.05, compared to sham.
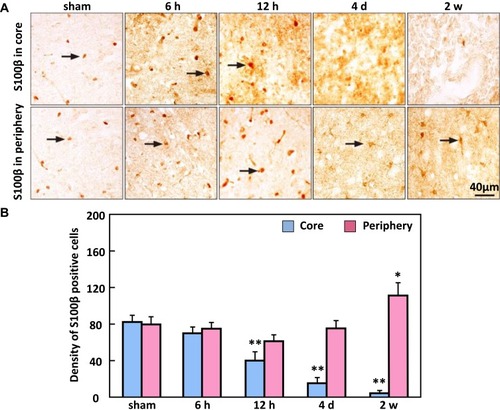
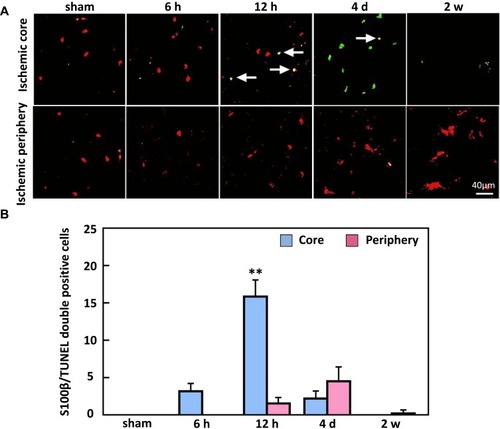
Figure 8 Double immunofluorescence staining of S100β and TUNEL. (A) Representative images indicate S100β and TUNEL double-positive cells, and (B) the density of double-positive cells significantly increased by 4 d post-ischemia in the core region of the cortex. Arrows show that double-positive cells. Bar scale=40 µm. **P < 0.01, compared to sham.