Figures & data
Table 1 Clinical Characteristics of the 70 TSE Patients and Single-Factor Analysis of the Related Risk Factors
Table 2 Logistic Multivariate Regression Analysis of Risk Factors for TSE to CSDH Evolution
Table 3 ROC Model of the Independent Risk Factors
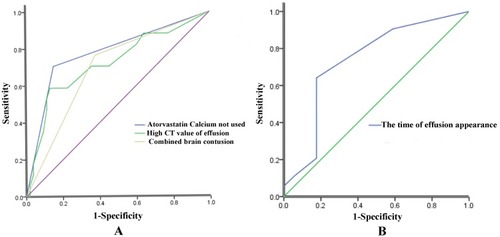
Figure 1 Receiver operating characteristic curve of the independent risk factors obtained from the multivariate logistic regression analysis. (A) combined brain contusion (AUC = 0.694, P = 0.017), no consumption of atorvastatin calcium (AUC = 0.777, P = 0.001), high CT value of effusion (AUC = 0.720, P = 0.007). (B) the time of the effusion appearance (AUC = 0.735, P = 0.004).