
Figures & data
Figure 1 Typical fundus photographs of myopia patients before and after surgery.
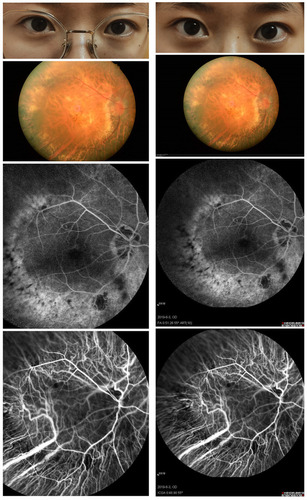
Table 1 Demographics and Visual Measurements Between PRL and POL Groups
Table 2 Brain Areas with Significantly Different ALFF Values Between Groups
Figure 2 Spontaneous brain activity in the PRL and POL groups. (A) The different ALFF regions between the PRL and POL groups. (B) Significant difference of brain activity in cerebrum. The red regions indicate higher ALFF values, and the green and blue regions imply lower AFLL values.
Abbreviations: ALFF, amplitude of low-frequency fluctuation; L, left; R, right.
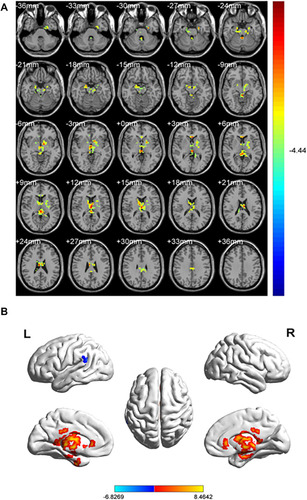
Figure 3 The mean ALFF values between PRL and POL groups.
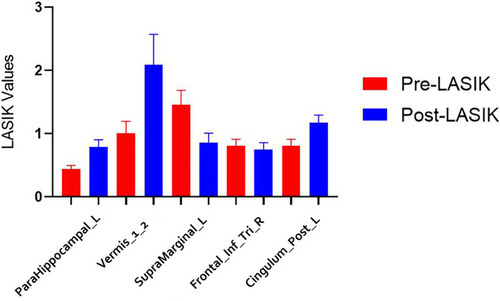
Figure 4 ROC curve analysis of the mean ALFF values for altered brain regions. (A) The area under the ROC curve was 0.980 (P<0.001; 95% CI=0.937–1.000) for SupraMarginal_L, Frontal_Inf_Tri_R 1.000 (P<0.001; 95% CI=1.000–1.000). (B) The area under the ROC curve was 0.987 (P<0.001; 95% CI=0.952–1.000) for Cingulum_Post_L; ParaHippocampal_L 1.000 (P<0.001; 95% CI=1.000–1.000); Vermis_1_2 1.000 (P<0.001; 95% CI=1.000–1.000).
Abbreviations: ALFF, amplitude of low-frequency fluctuation; AUC, area under the curve; ROC, receiver operating characteristic; L, left; R, right; Cingulum_Post_L, left posterior cingulate cortex; Frontal_Inf_Tri_R, right trigonometric inferior frontal gyrus.
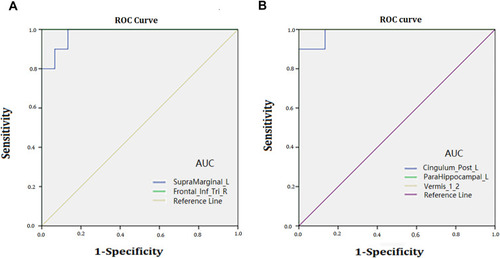
Figure 5 Correlations between the HADS and ALFF values of left parahippocampal gyrus and left posterior cingulate cortex. The results shown in (A) and (B) both represent a negative correlation with the HADS and ALFF values in left parahippocampal gyrus and left posterior cingulate cortex, respectively.
Abbreviations: HADS, Hospital Anxiety and Depression Scale; ALFF, amplitude of low-frequency fluctuation.
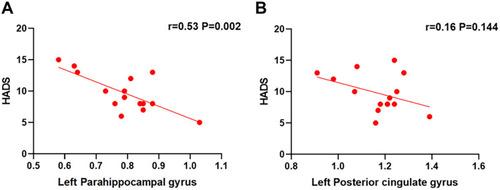
Figure 6 Significant differences in spontaneous brain activity between the PRL and POL groups. Different brain regions that were observed: 1) SupraMarginal_L; 2) Frontal_Inf_Tri_R; 3) Cingulum_Post_L; 4) ParaHippocampal_L; and 5) Vermis_1_2. The yellow areas present brain areas with increased ALFF values, and the purple areas present brain areas with decreased ALFF values.
Abbreviations: ALFF, amplitude of low-frequency fluctuation; L, left; R, right; Cingulum_Post_L, left posterior cingulate cortex; Frontal_Inf_Tri_R, right trigonometric inferior frontal gyrus.
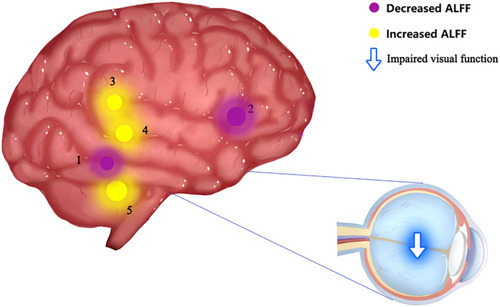
Figure 7 The relationship between changes in internal eye states and vision, brain activity, and emotional state.
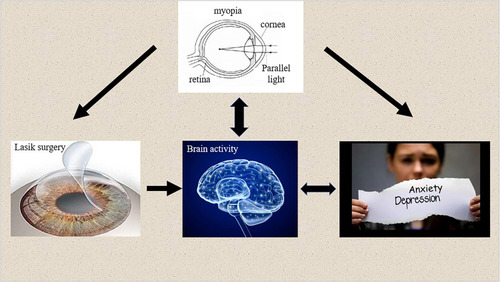
Table 3 Brain Regions with Altered ALFF Values and the Potential Impacts