Figures & data
Table 1 Baseline characteristics for olanzapine and risperidone initiators
Figure 1 Patient selection. The diagram displays the number of olanzapine and risperidone initiators remaining after each of the inclusion and exclusion criteria were applied. The continuous enrollment criteria required each patient to have at least one claim prior to and following the study period.
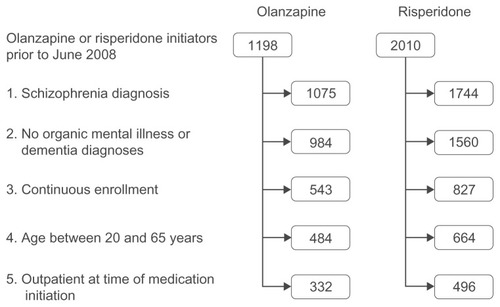
Table 2 Initial concomitant antipsychotic treatment
Figure 2 Percentage of patients treated with monotherapy during the 12 months following initiation of olanzapine or risperidone. The generalized estimating equation model showed that, after correcting for baseline characteristics, patients initiated on olanzapine were significantly more likely to be treated with monotherapy across the 12-month treatment period (P = 0.001) and the rate of monotherapy increased over time (P < 0.001).
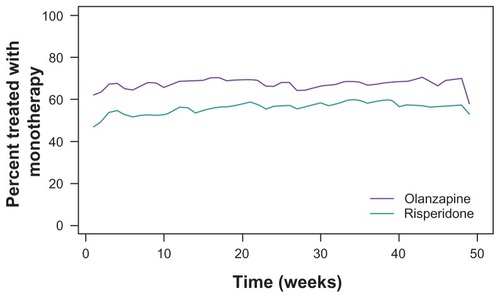
Table 3 Results of generalized estimating equation model predicting probability of monotherapy over the 12-month study
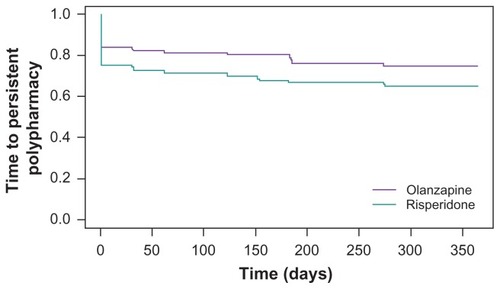
Figure 3 Time to persistent antipsychotic polypharmacy for olanzapine- and risperidone-initiated patients. The log-rank test indicated that olanzapine patients had a significantly longer time to persistent polypharmacy (P = 0.002) than risperidone patients.