
Figures & data
Table 1 Characteristics of the Subjects and Their Correlation with PPSR Scores on BJSQ or Effects on PPSR Scores
Table 2 Characteristics of Adult Workers and Their Effects on PPSR
Figure 1 Results of the path analysis. Path analysis of the data of 535 adult workers regarding Diurnal Type Scale (DTS) score, Pittsburgh Sleep Quality Index (PSQI) global score, perceived job stressors on the Brief Job Stress Questionnaire (BJSQ), and psychological and physical stress response (PPSR) on the BJSQ. The solid arrows represent statistically significant direct paths. The numbers beside the arrows show the standardized path coefficients (minimum: −1; maximum: 1). *p < 0.05, ***p < 0.001.
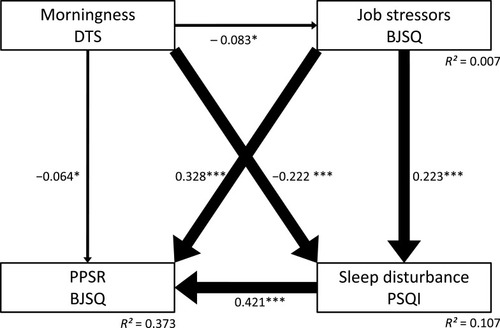
Table 3 Correlation (r) Between DTS, Sleep Disturbance (PSQI), Perceived Job Stressors, PPSR of BJSQ, Social Support of BJSQ, and Satisfaction of BJSQ
Table 4 Standardized Path Coefficients Between Each Variable