Figures & data
Table 1 The Sequences of Primers
Figure 1 The depressive behaviors and expression of miR-144 in the CUMS rats. (A) Weight changes of rats in each group. (B) The relative sucrose preference of rats in each group was tested by Sucrose preference assay. (C) Locomotion of rats in each group was tested by open field test. (D) The time in open arms of rats in each group. (E) Immobility time of rats in each group. (F) Determination of the expression of miR-144 in the hippocampus by qRT-PCR. (G, H) Determination of the protein expression of PTP1B, pTrkB, and BDNF in the hippocampus by Western Blotting. Data are presented as mean±SD from at least three independent experiments.
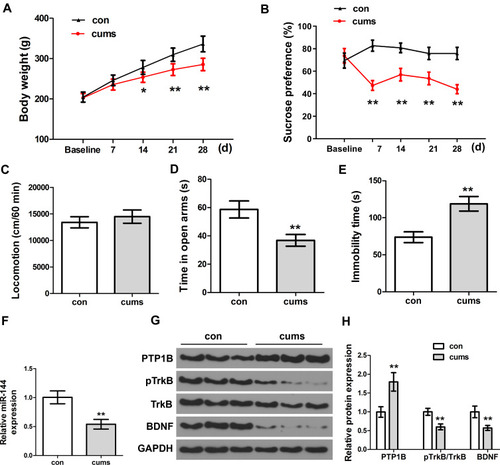
Figure 2 Effect of miR-144 on depressive behaviors in CUMS rats. (A) The relative sucrose preference of rats in each group. (B) The time in open arms of rats in each group was tested by Elevated maze. (C) Immobility time of rats in each group. (D) The sucrose preference of rats in each group. (E) The time in open arms of rats in each group. (F) The immobility time of rats in each group. (G) The escape latency of rats in each group. (H) The swimming distance of rats in each group. Data were presented as mean±SD from at least three independent experiments.
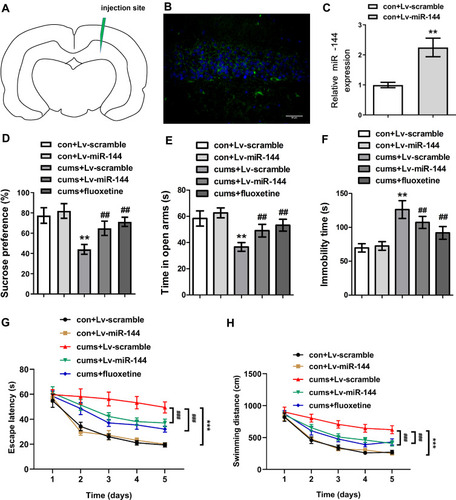
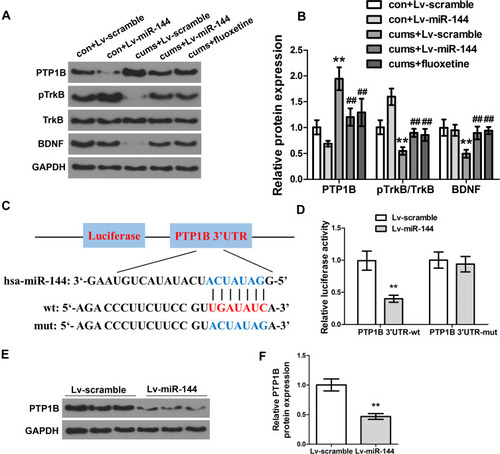
Figure 3 Effect of miR-144 on the PTP1B/TrkB/BDNF signaling pathway. (A, B) Detection of the protein expression of PTP1B, pTrkB, and BDNF in the hippocampus by Western Blotting. (C) Schematic diagram of miR-144 binding sites in PTP1B 3ʹ-UTR. (D) Detection of the luciferase activity of PTP1B 3ʹ-UTR-WT and PTP1B 3ʹ-UTR-MUT genes in HEK293T cells. (E, F) Detection of the protein expression of PTP1B in primary hippocampus neurons transfected with LV-scramble or LV-miR-144 by Western Blotting. Data were presented as mean±SD from at least three independent experiments.