Figures & data
Figure 1 Number of enrolled patients.
Abbreviations: ECT, electroconvulsion therapy; rTMS, transcranial magnetic stimulation; deepTMS, deep transcranial magnetic stimulation.
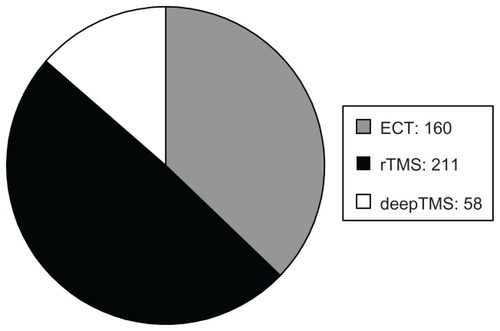
Table 1 Included studies
Figure 2 HDRS-24 % decrease in patients treated with ECT, rTMS, and deepTMS from baseline to the fourth week of treatment.
Abbreviations: HDRS, Hamilton Depression Rating Scale; ECT, electroconvulsion therapy; rTMS, transcranial magnetic stimulation; deepTMS, deep transcranial magnetic stimulation.
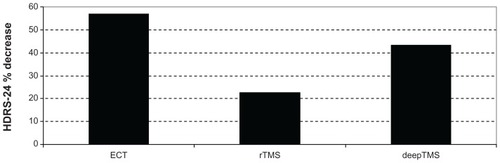
Figure 3 HDRS-24 % decrease in patients treated with ECT and deepTMS after 2 and 4 weeks of treatment.
Abbreviations: HDRS, Hamilton Depression Rating Scale; ECT, electroconvulsion therapy; deepTMS, deep transcranial magnetic stimulation.
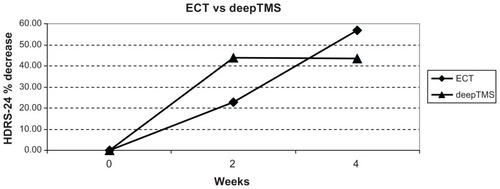
Figure 4 Cognitive variations in patients treated with ECT and rTMS from T0 to T1 (2 weeks of treatment).
Abbreviations: ECT, electroconvulsion therapy; RBMT, Rivermead Behavioral Memory Test; rTMS, transcranial magnetic stimulation; WAIS, Weschler Adult Intelligence Scale; WAIS-R, Weschler Adult Intelligence Scale-Revised; WMS, Wechsler Memory Scale.
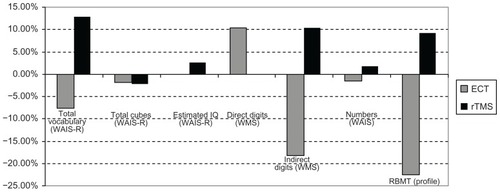
Figure 5 Cognitive variations in patients treated with ECT and rTMS from T0 to T2 (4 weeks of treatment).
Abbreviations: ECT, electroconvulsion therapy; RBMT, Rivermead Behavioral Memory Test; rTMS, transcranial magnetic stimulation; WAIS, Weschler Adult Intelligence Scale; WAIS-R, Weschler Adult Intelligence Scale-Revised; WMS, Wechsler Memory Scale.
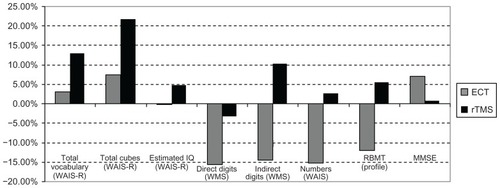
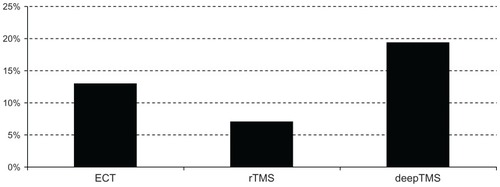
Figure 6 Percentage of remitted patients.
Abbreviations: ECT, electroconvulsion therapy; rTMS, transcranial magnetic stimulation; deepTMS, deep transcranial magnetic stimulation.
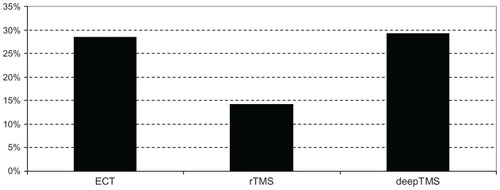
Figure 7 Percentage of dropped-out patients.
Abbreviations: ECT, electroconvulsion therapy; rTMS, transcranial magnetic stimulation; deepTMS, deep transcranial magnetic stimulation.