
Figures & data
Figure 1 Schematic diagram of neural network training.
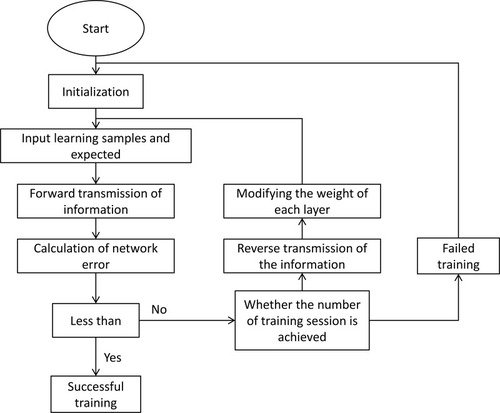
Figure 2 Support vector machine diagram.
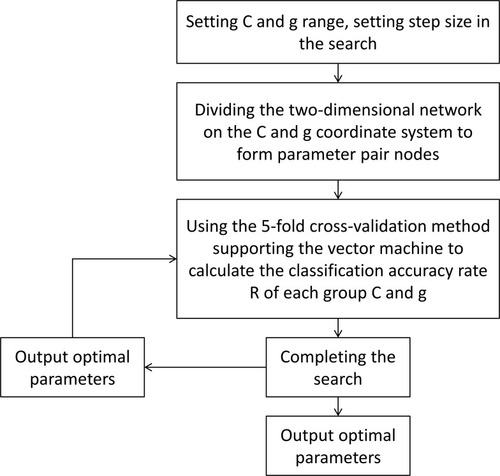
Figure 3 Local schematic diagram of the two-level regression tree model.
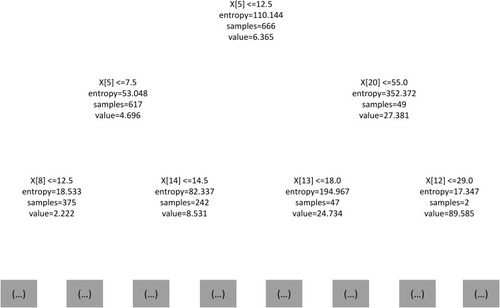
Table 1 The Sensitivity, Specificity, and AUC of Three Machine Learning Methods (Neural Network, Support Vector Machine, and Decision Tree) for Evaluating the Depression Status of Chinese Recruits
Figure 4 Receiver operating characteristics (ROC) curve for depression in Chinese recruits from three machine learning methods: support vector machine (blue line), neural network (orange line), and decision tree (green line).
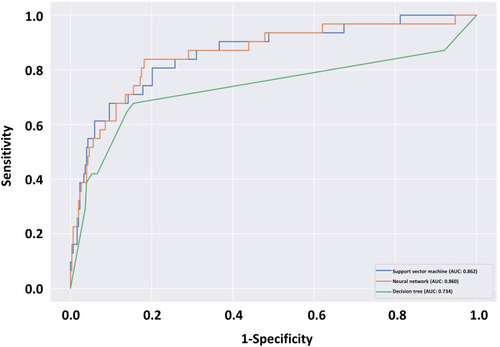
Table 2 Comparison of Regression Model Parameters of Three Machine Learning Methods (Neural Network, Support Vector Machine, and Decision Tree)