
Figures & data
Figure 1 Search Results and Study Selection.
Note: Articles retrieved from other sources refer to papers identified from bibliographic review of relevant published systematic reviews. PRISMA figure adapted from Liberati A, Altman D, Tetzlaff J, et al. The PRISMA statement for reporting systematic reviews and meta-analyses of studies that evaluate health care interventions: explanation and elaboration. Journal of clinical epidemiology. 2009;62(10). Creative Commons.Citation57
Abbreviation: NHS EED, National Health Service Economic Evaluation Database.
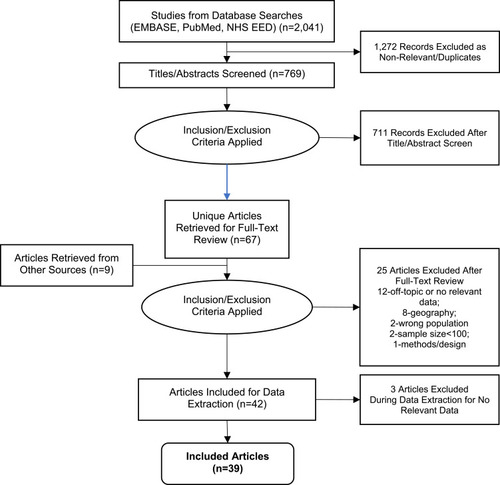
Table 1 SGA Dosing
Table 2 Adherence with SGAs and BD Medications (Multiple Classes Including SGAs)
Table 3 Factors Associated with Suboptimal Adherence with SGA Regimen in Analyses of Health Care Claims
Table 4 Persistence with Oral SGAs or BD Medication
Table 5 Duration of Therapy and Treatment Gaps with SGAs
Table 6 Prevalence of Combination Treatment
Table 7 Utilization Patterns with SGAs Associated with Increased HCRU or Costs