Figures & data
Table 1 Detailed Information of the Elderly Recruited Subjects
Figure 1 Metabolomic analysis of urine samples from different groups: (A) OPLS-DA model built with training set showed that the elderly PSD subjects (blue dot) could be intelligibly separated from the elderly non-depressed subjects (green dot); (B) T-predicted scatter plot showed that the model could effectively predict the elderly PSD subjects (blue dot) and elderly non-depressed subjects (green dot) from the testing set.
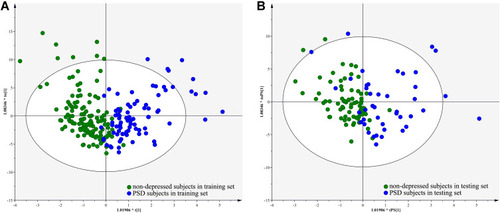
Table 2 Important Metabolites Responsible for Diagnosing Elderly PSD Patients
Figure 2 Relative concentrations of these eight urinary metabolite biomarkers for elderly PSD (mean±standard deviation).
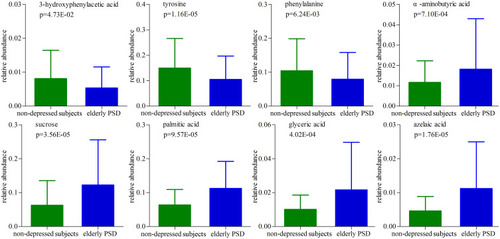
Figure 3 Diagnostic performance of potential biomarker panel for elderly PSD: (A) AUC value in the training set; (B) AUC value in the testing set.
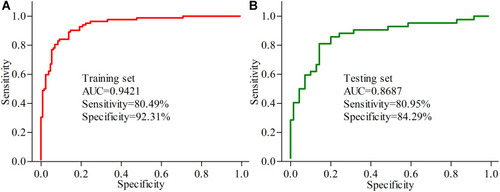
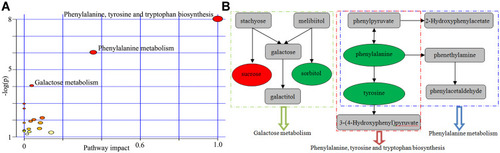
Figure 4 Pathway analysis using the differential urinary metabolites: (A) three metabolic pathways were found to be significantly affected in elderly PSD subjects; (B) the main metabolites involved in these pathways. Red and green ellipses represent the significantly increased and decreased metabolites, respectively, identified in this study.