80
Views
0
CrossRef citations to date
0
Altmetric
Original Research

Reduced Synaptic Plasticity Contributes to Resistance Against Constant-Stimulus Electroconvulsive Treatment in a Rat Model of Stress-Induced Depression

, , , &
Pages 1433-1442 | Published online: 11 May 2021

Figures & data

Figure 1 Experimental timeline.

Figure 1 Experimental timeline.

Figure 2 SPP before and after ECSs. *P < 0.05 vs C. #P < 0.05 vs D. P < 0.05 vs DE1. ΔP < 0.05 vs DE3.

Figure 2 SPP before and after ECSs. *P < 0.05 vs C. #P < 0.05 vs D. ∇P < 0.05 vs DE1. ΔP < 0.05 vs DE3.

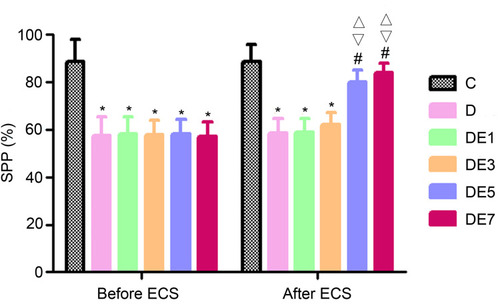
Table 1 SPP of Each Rat Before and After ECS

Figure 3 MWM outcomes for different groups. (A) Swimming speed. (B) Escape latency. (C) Space exploration time. *P < 0.05 vs C. #P < 0.05 vs D. P < 0.05 vs DE1. ΔP < 0.05 vs DE3.

Figure 3 MWM outcomes for different groups. (A) Swimming speed. (B) Escape latency. (C) Space exploration time. *P < 0.05 vs C. #P < 0.05 vs D. ▽P < 0.05 vs DE1. ΔP < 0.05 vs DE3.

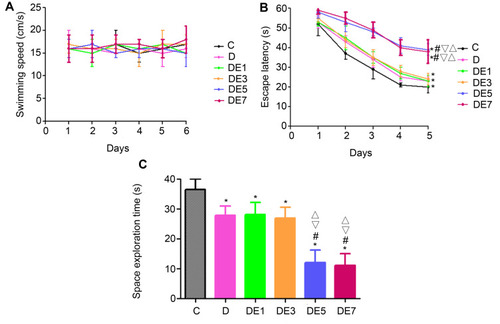
Table 2 Space Exploration Time of Each Rat

Figure 4 Baseline fEPSP in the hippocampal SC-CA1 pathway. (A) Diagrammatic representation of a hippocampal cross-section showing the stimulating and recording electrodes. (B) Field potentials recorded from hippocampal SC-CA1. The baseline fEPSP slope was measured for the region between the red lines. (C) Comparison of baseline fEPSP slopes. *P < 0.05 vs C. #P < 0.05 vs D. P < 0.05 vs DE1. ΔP < 0.05 vs DE3.

Figure 4 Baseline fEPSP in the hippocampal SC-CA1 pathway. (A) Diagrammatic representation of a hippocampal cross-section showing the stimulating and recording electrodes. (B) Field potentials recorded from hippocampal SC-CA1. The baseline fEPSP slope was measured for the region between the red lines. (C) Comparison of baseline fEPSP slopes. *P < 0.05 vs C. #P < 0.05 vs D. ▽P < 0.05 vs DE1. ΔP < 0.05 vs DE3.

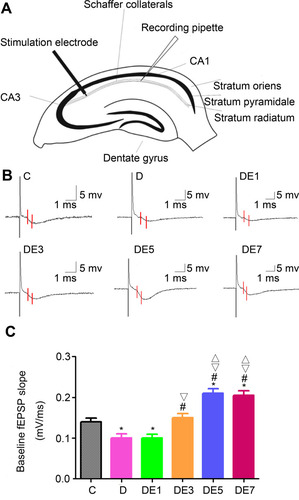
Table 3 Baseline fEPSP of Each Rat

Figure 5 LTP in the hippocampal SC-CA1 pathway. (A) Post-fEPSP after high-frequency stimulation. The black trace indicates the pre-stimulation baseline; the red trace indicates the post-stimulation recording. Horizontal scale bar, 5 ms; vertical scale bar, 1 mV. Arrows indicate the stimulus (200 pulses at 100 Hz). (B) Comparison of post- fEPSP. *P < 0.05 vs C. #P < 0.05 vs D. P < 0.05 vs DE1. ΔP < 0.05 vs DE3.

Figure 5 LTP in the hippocampal SC-CA1 pathway. (A) Post-fEPSP after high-frequency stimulation. The black trace indicates the pre-stimulation baseline; the red trace indicates the post-stimulation recording. Horizontal scale bar, 5 ms; vertical scale bar, 1 mV. Arrows indicate the stimulus (200 pulses at 100 Hz). (B) Comparison of post- fEPSP. *P < 0.05 vs C. #P < 0.05 vs D. ▽P < 0.05 vs DE1. ΔP < 0.05 vs DE3.

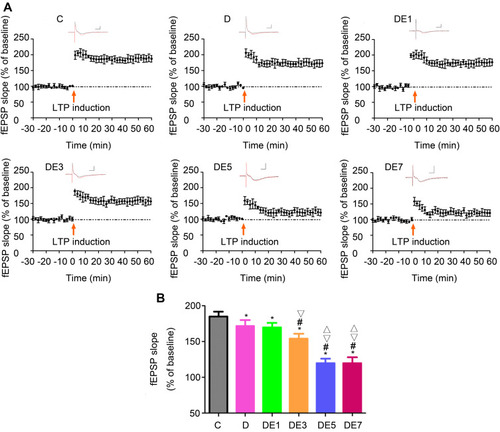
Table 4 fEPSP of Each Rat