Figures & data
Table 1 Primer Sequences for RT-qPCR
Figure 1 LncRNA GABPB1-AS1 is highly expressed in glioma samples. (A and B) differentially expressed mRNAs and lncRNAs between glioma tissues and normal tissues analyzed using a GEO GSE2223 dataset; (C) expression of GABPB1-AS1 in collected normal brain tissues (n = 14) and glioma tissues (n = 58) examined by RT-qPCR; (D) diagnostic value of GABPB1-AS1 in glioma analyzed using a ROC; (E) correlation of GABPB1-AS1 expression with the glioma grade in patients; (F) GABPB1-AS1 expression in glioma cell lines LN229, U251, SHG44 and A172 and in the astrocyte cell line A735 examined by RT-qPCR; (G) expression of GABPB1-AS1 in different type of cancer cells predicted using CCLE bioinformatic system; (H) major roles of GABPB1 in cancer cells predicted using the LnCecell system. Data were collected from three independent experiments and expressed as the mean ± SD. Data were analyzed by unpaired t-test (C) or one-way ANOVA (E and F). ***p < 0.001 vs Normal/Grade I/A735 cells.
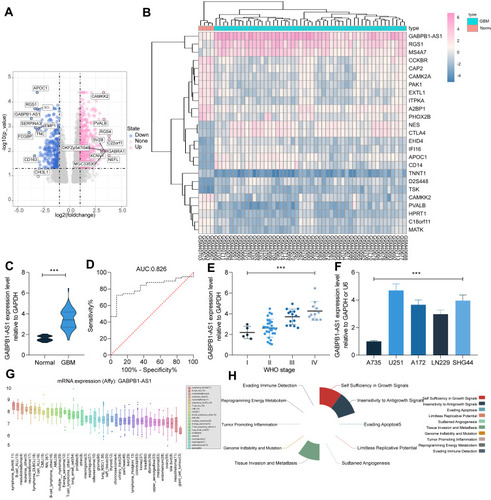
Figure 2 GABPB1-AS1 knockdown suppresses growth of glioma cells. (A) transfection efficacy of shRNA-#1 and shRNA-#2 of GABPB1-AS1 in U251 and SHG44 cells examined by RT-qPCR; (B) protein levels of GABPB1 and TERT in U251 and SHG44 cells examined by Western blot analysis; (C) viability of cells after GABPB1-AS1 knockdown determined by the CCK-8 method; (D) apoptosis rate of U251 and SHG44 cells after GABPB1-AS1 knockdown examined by flow cytometry; (E) expression of EMT-related markers ZO-1, E-cadherin and N-cadherin in U251 and SHG44 cells after GABPB1-AS1 inhibition quantified by RT-qPCR; (F and G) migration (F) and invasion (G) abilities of U251 and SHG44 cells after GABPB1-AS1 downregulation detected by Transwell assays. Data were collected from three independent experiments and expressed as the mean ± SD. Data were analyzed by two-way ANOVA. **p < 0.01.
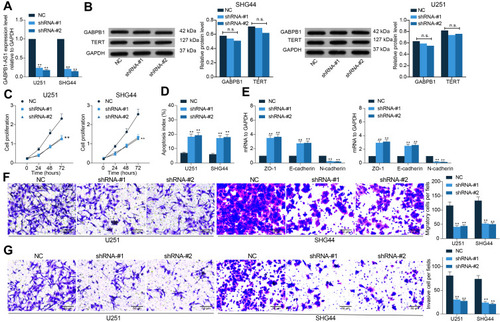
Figure 3 GABPB1-AS1 knockdown suppresses growth and metastasis of glioma cells in vivo. (A) growth rate of the xenograft tumors in nude mice within 30 d after subcutaneous injection of U251 and SHG44 cells; (B) weight of the xenograft tumors in nude mice on the 30th d; (C) Ki67 expression in the xenograft determined by IHC staining; (D and E) number of metastatic nodules in mouse lung and liver tissues observed by HE staining. N = 6 in each group. Data were collected from three independent experiments and expressed as the mean ± SD. Data were analyzed by two-way ANOVA. **p < 0.01, ***p < 0.001 vs NC group.
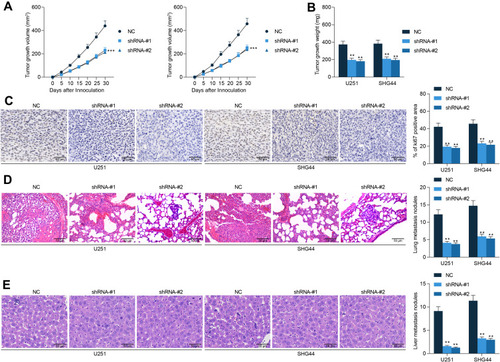
Figure 4 GABPB1-AS1 is sub-localized in cytoplasm and binds to miR-330. (A and B) subcellular localization of GABPB1-AS1 in cells predicted using the Lncatlas and LnCeCell systems; (C) subcellular localization of GABPB1-AS1 in U251 and SHG44 confirmed by a cytoplasmic and nuclear RNA separation assay; (D) candidate target miRNAs of GABPB1-AS1 predicted using three bioinformatic systems (StarBase, RNA22 and DIANA); (E) expression profiles of miR-330, miR-582, miR-590, miR-744, miR-151a and miR-301 in glioma predicted using the TCGA-GBM database; (F) correlation between poor miR-330 expression with prognosis in glioma according to the data in the TCGA-GBM database; (G) expression of miR-330 in collected normal brain tissues (n = 14) and glioma tissues (n = 58) examined by RT-qPCR; (H) a negative correlation between miR-330 and GABPB1-AS1 in glioma tissues according to a Spearman’s rank test; (I) putative binding sequence between GABPB1-AS1 and miR-330 and the mutant sequence for the construction of luciferase reporter vectors; (J and K) binding relationship between GABPB1-AS1 and miR-330 validated through a luciferase reporter gene assay (J) and an RNA pull-down assay; (L) expression of miR-330 in glioma cell lines LN229, U251, SHG44 and A172 and in the astrocyte cell line A735 examined using RT-qPCR; (M) expression of miR-330 in U251 and SHG44 after GABPB1-AS1 knockdown determined by RT-qPCR. Data were collected from three independent experiments and expressed as the mean ± SD. Data were analyzed by the unpaired t-test (G), one-way ANOVA (K), or two-way ANOVA (C, J and L). **p < 0.01, ***p < 0.001.
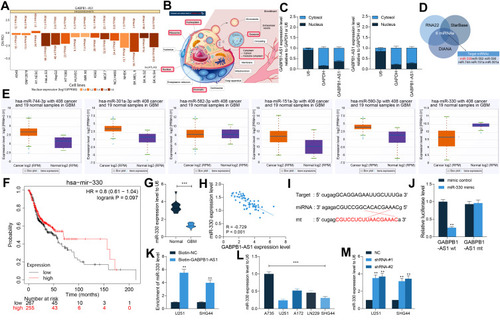
Figure 5 miR-330 restores viability of glioma cells suppressed by sh-GABPB1-AS1. (A) downregulation of miR-330 was further introduced in U251 and SHG44 cells following sh-GABPB1-AS1 transfection, and the transfection efficacy was validated by RT-qPCR; (B) viability of U251 and SHG44 cells after miR-330 inhibition determined by the CCK-8 method; (C) apoptosis rate of U251 and SHG44 cells after miR-330 inhibition examined by flow cytometry; (D–E) migration (D) and invasion (E) abilities of U251 and SHG44 cells after miR-330 inhibition detected by Transwell assays. Data were collected from three independent experiments and expressed as the mean ± SD. Data were analyzed by two-way ANOVA. **p < 0.01 vs shRNA + Inhibitor NC group.
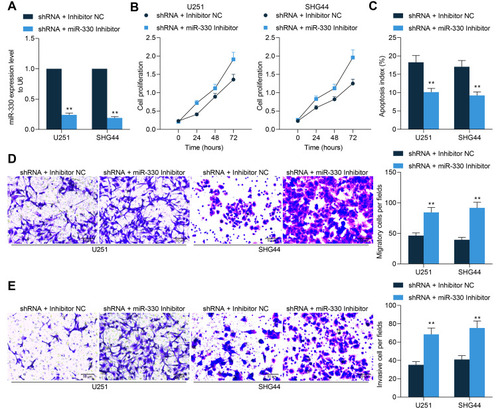
Figure 6 miR-330 negatively regulates ZNF367. (A) mRNAs showing a less than −0.4 correlation coefficient with miR-330 in the TCGA-GBM database were analyzed using a R Corr Package, and the outcomes were compared with the targeting mRNAs of miR-330 predicted using bioinformatic systems TargetScan, miRDB and StarBase; (B) expression of ZNF367 in the TCGA-GBM database; (C) correlation between ZNF367 expression and the immune infiltration in glioma predicted using the TIMER website; (D) correlation between ZNF367 expression and the survival of patients with glioma; (E) ZNF367 expression in different cell lines according to the data from the CCLE database; (F) ZNF367 expression in 14 normal brain tissues and 58 glioma tissues examined by RT-qPCR; (G) correlation between ZNF367 expression and GABPB1-AS1 or miR-330; (H) putative binding site between miR-330 and ZNF367 mRNA obtained from the StarBase system; (I) binding relationship between miR-330 and ZNF367 mRNA validated using a luciferase reporter gene assay; (J) expression of ZNF367 in glioma cells and A735 cells examined by RT-qPCR; (K) expression of ZNF367 in U251 and SHG44 cells examined by RT-qPCR. Data were collected from three independent experiments and expressed as the mean ± SD. Data were analyzed by the unpaired t-test (F), one-way ANOVA (J), or two-way ANOVA (I and K). *p < 0.05, **p < 0.01, ***p < 0.001 vs normal/mimic control/A735 cells/NC; ##p < 0.01 vs shRNA + Inhibitor NC.
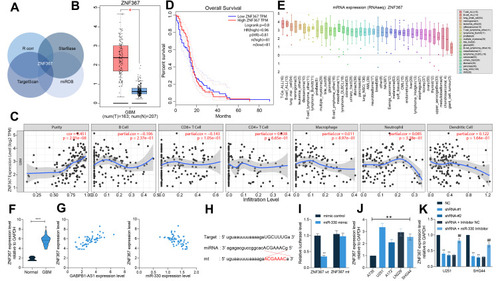
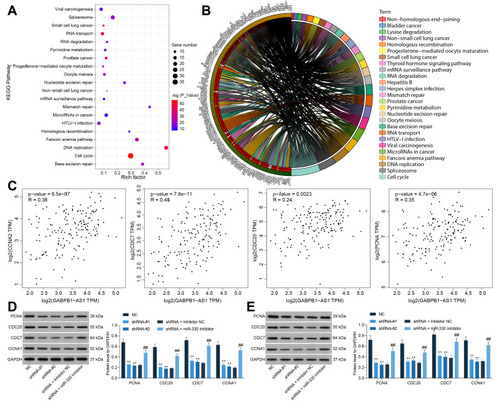
Figure 7 ZNF367 activates the cell cycle signaling pathway to promote glioma progression. (A and B) a KEGG analysis based on the genes showing a strong relevance (correlation coefficient R > 0.05) to ZNF367 in the TCGA-GBM database; (C) correlations between GABPB1-AS1 and the cell cycle-related factors PCNA, CDC20, CDC7 and CCNA1 predicted in the TCGA-GBM database; (D and E) protein levels of PCNA, CDC20, CDC7 and CCNA1 in U251 and SHG44 cells examined by Western blot analysis. Data were collected from three independent experiments and expressed as the mean ± SD. Data were analyzed by two-way ANOVA. **p < 0.01 vs NC group, ##p < 0.01 vs shRNA + Inhibitor NC group.