Figures & data
Table 1 Visual perception test for agnosiaCitation8
Figure 1 Magnetic resonance imaging coronal sections of fluid-attenuated inversion recovery images on first examination. The calcarine sulcus (arrow) and collateral sulcus (arrow head) were broader on the right than the left. The finding was temporo-parieto-occipital lobe atrophy with right-side dominance.
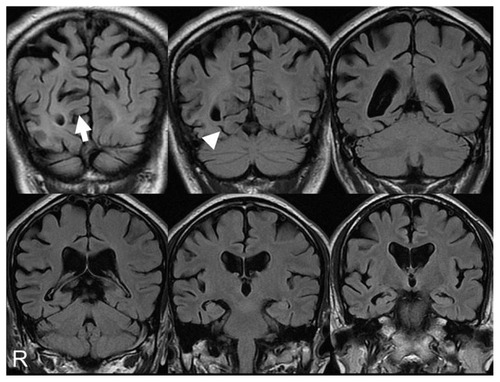
Figure 2 99mTc-ethyl cysteinate dimer SPECT using eZISCitation10 on first examination showed decreased blood flow in the temporo-parieto-occipital lobe with right-side dominance.
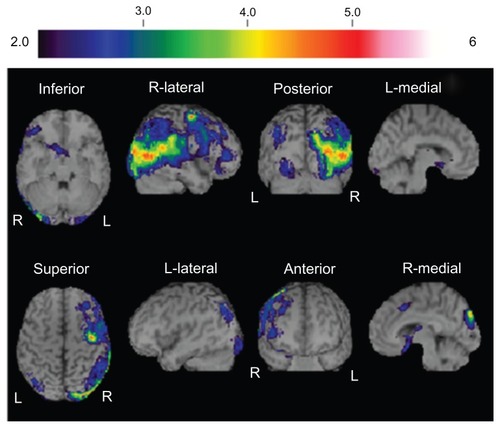
Figure 3 18F-fluorodeoxyglucose positron emission tomography, 7 months after first examination, showing hemihypometabolism, especially from the inferior lateral temporal lobe to the lateral occipital lobe.
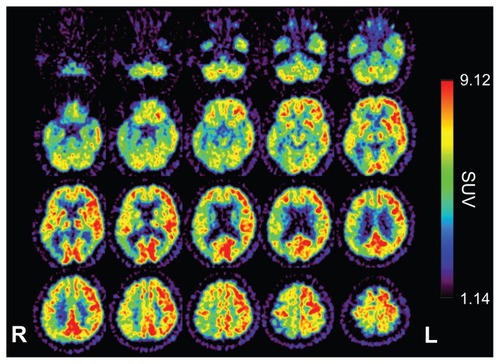
Figure 4 Magnetic resonance imaging coronal sections of fluid-attenuated inversion recovery images 11 months after first examination showed progression of temporo-parieto-occipital lobe atrophy with right-side dominance.
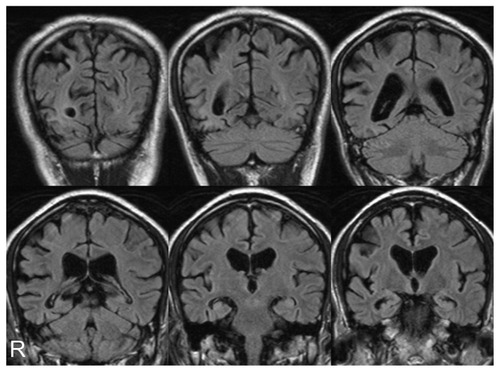
Figure 5 99mTc-ethyl cysteinate dimer SPECT using the eZISCitation10 11 months after first examination showed decreased blood flow in the temporo-parieto-occipital lobe with right-side dominance.
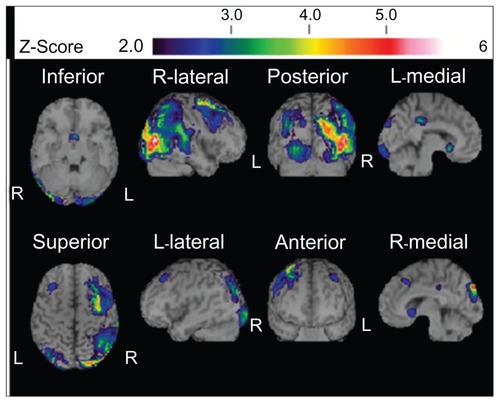
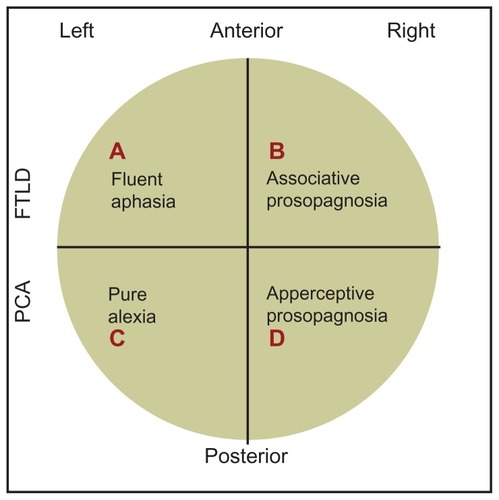
Figure 6 A simple, schematic diagram of the relative loci of associative and apperceptive prosopagnosia, fluent aphasia, and pure alexia. Our own case history of PCA/apperceptive prosopagnosia relates to area D in the ventral part of the right posterior area of the brain.