Figures & data
Figure 1 A schematic representation of the experimental procedures (TS model and treatments procedure in rats).
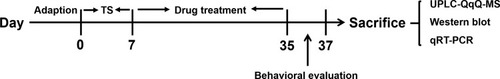
Table 1 Primer Sequences Used for the qRT-PCR Analysis
Figure 2 Effects of Gas treatment on stereotypy score of rats with TS induced by IDPN.
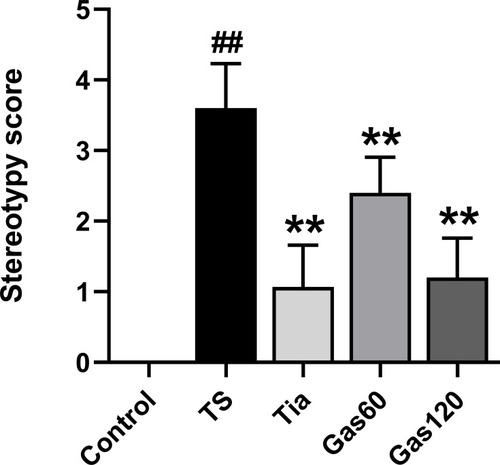
Figure 3 Effects of Gas treatment on nodding numbers of rats with TS induced by IDPN.
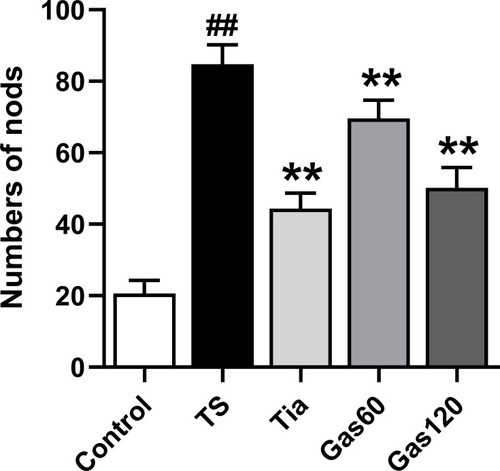
Figure 4 Effects of Gas treatment on autonomic activity of rats with TS induced by IDPN.
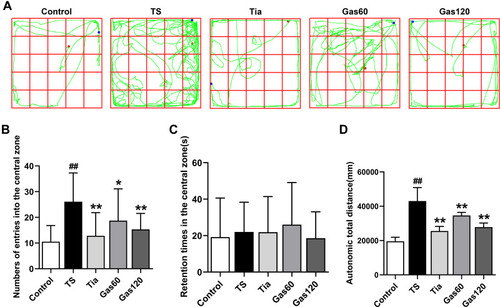
Figure 5 Effects of Gas treatment on Glu level in the striatum of the rats with TS induced by IDPN.
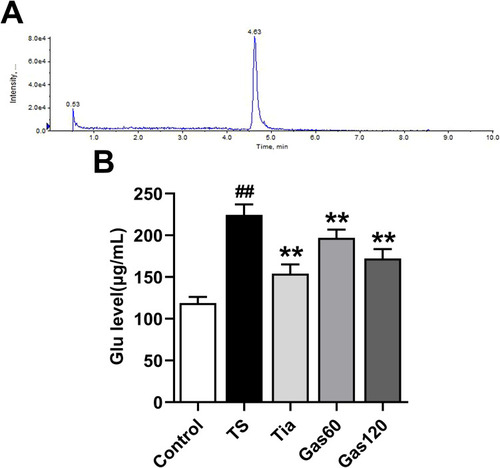
Figure 6 Effects of Gas treatment on the protein expression of EAAT1, EAAT2, NMDAR1, NMDAR2A and NMDAR2B in the striatum of the rats with TS induced by IDPN.
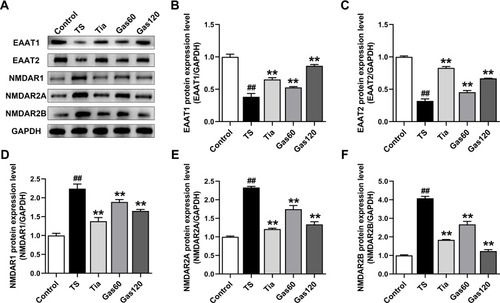
Figure 7 Effects of Gas treatment on the mRNA expression of EAAT1, EAAT2, NMDAR1, NMDAR2A and NMDAR2B in the striatum of the rats with TS induced by IDPN.
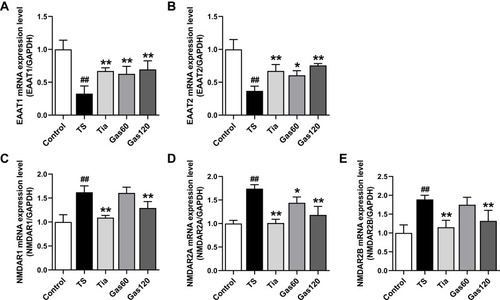
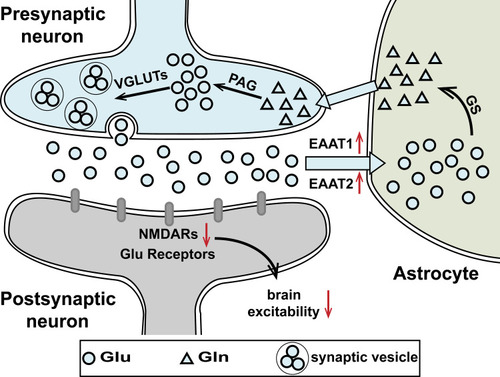
Figure 8 A schematic illustration of the proposed mechanism by which Gas alleviates Tourette syndrome in rats.