Figures & data
Table 1 Primer Sequences Used for RT-PCR
Table 2 Neurological Deficit Scores in Each Group (n=12)
Figure 1 Morphologic changes and neuronal apoptosis in the ischemic cortex. (A) Images show HE and TUNEL staining in each group (400×). (B). Statistical analysis of the TUNEL index in each group. The data are presented as the mean ± SD (n = 12). Compared to the sham group, *P<0.05. Compared to the model group, #P<0.05. Compared to the EA group, &P<0.05. Compared to the AG490 group, @P<0.05.
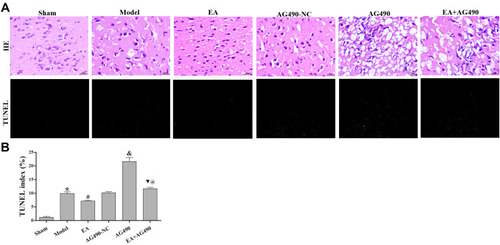
Figure 2 Neuronal ultrastructure in the ischemic cortex at 72 h post-FCI was observed by transmission electron microscopy (uranyl acetate-lead citrate staining, 12, 000×).
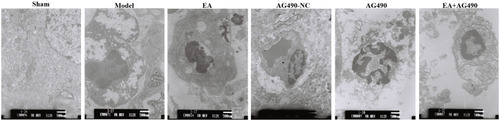
Figure 3 EPO-JAK2-STAT5 pathway-related (A) and apoptosis-related (B) gene expression in the ischemic cortex. qRT-PCR was performed to measure the relative mRNA levels of HIF-1α, EPO, JAK2, STAT5, HSP70, Bax and Bcl-2 at 72 h post-FCI. Compared to the sham group, *P<0.05. Compared to the model group, #P<0.05. Compared to the AG490-NC group, &P<0.05. Compared to the EA group, ▼P<0.05. Compared to the AG490 group, @P<0.05.
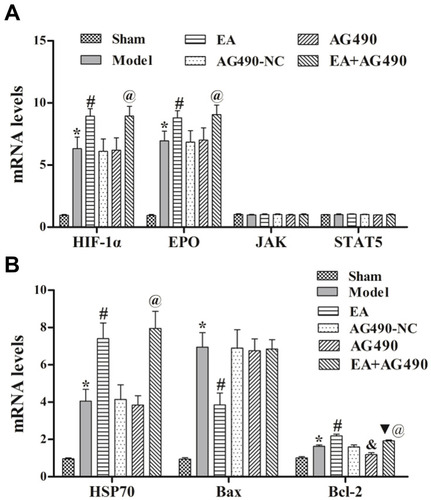
Figure 4 EPO-JAK2-STAT5 pathway-related gene and protein expression in the ischemic cortex. (A) Immunohistochemistry was performed to measure the relative protein levels of HIF-1α, EPO, p-JAK2 and p-STAT5 at 72 h post-FCI (400×). (B) MOD of the HIF-1α protein level in each group. (C) MOD of the EPO protein level in each group. (D) MOD of the p-JAK2 protein level in each group. (E) MOD of the p-STAT5 protein level in each group. The data are presented as the mean ± SD (n = 12). Compared to the sham group, *P<0.05. Compared to the model group, #P<0.05. Compared to the AG490-NC group, &P<0.05. Compared to the EA group, ▼P<0.05. Compared to the AG490 group, @P<0.05.
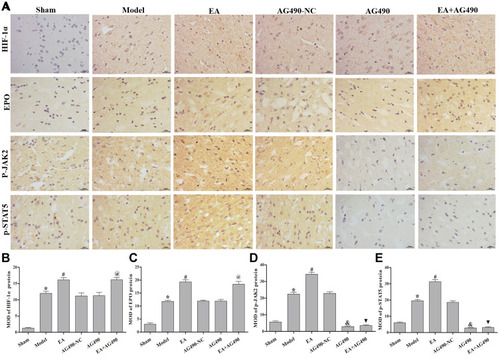
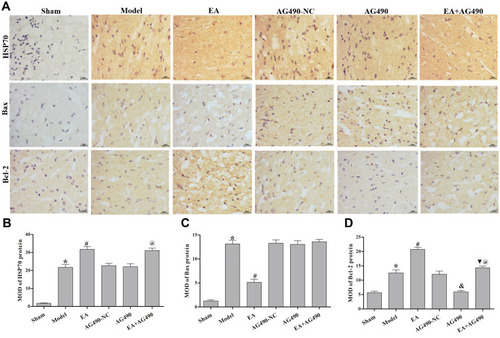
Figure 5 Apoptosis-related protein expression in the ischemic cortex. (A) Immunohistochemistry was performed to measure the protein levels of HSP70, Bax and Bcl-2 at 72 h post-FCI (400×). (B) MOD of the HSP70 protein level in each group. (C) MOD of the Bax protein level in each group. (D) MOD of the Bcl-2 protein level in each group. The data are presented as the mean ± SD (n = 12). Compared to the sham group, *P<0.05. Compared to the model group, #P<0.05. Compared to the AG490-NC group, &P<0.05. Compared to the EA group, ▼P<0.05. Compared to the AG490 group, @P<0.05.