Figures & data
Figure 1 Effect of GAA on PSD-induced depressive-like behaviors in rats. (A) Experimental timeline. (B) The structural formula of GAA. (C) Body weight in each group. (D and E) The horizontal and vertical motion scores of open field test (OFT) in each group. (F) Sucrose preference test (SPT) consumption in each group. n=8. MCAO: stroke model; PSD: CUMS after MCAO; L-GAA: low dose (10 mg/kg) of GAA; M-GAA: median dose (20 mg/kg) of GAA; H-GAA: high dose (30 mg/kg) of GAA. **P<0.01 and ***P<0.001 compared with MCAO group; #P<0.05, ##P<0.01, and ###P<0.001 compared with PSD group.
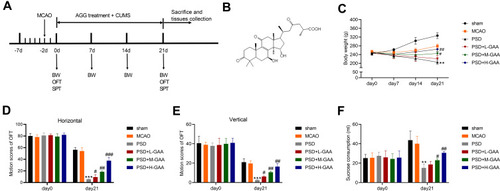
Figure 2 Effect of GAA on PSD-induced neuronal damage in the hippocampus. (A) The histological analysis of hippocampus by HE staining. (B–D) Western blotting for protein levels of BDNF and NGF in hippocampus tissues. n=8. MCAO: stroke model; PSD: CUMS after MCAO; L-GAA: low dose (10 mg/kg) of GAA; M-GAA: median dose (20 mg/kg) of GAA; H-GAA: high dose (30 mg/kg) of GAA. **P<0.01 compared with the sham group; &P<0.05 compared with the MCAO group; #P<0.05 and ##P<0.01 compared with the PSD group.
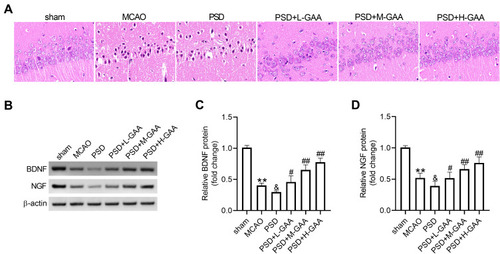
Figure 3 Influence of GAA on inflammatory cytokine expression in PSD rats. (A–D) ELISA assay of TNF-α, IL-1β, IL-6, and IL-10 in hippocampus. (E–H) qRT-PCR for expression of TNF-α, IL-1β, IL-6, and IL-10 in hippocampus. n=8. MCAO: stroke model; PSD: CUMS after MCAO; L-GAA: low dose (10 mg/kg) of GAA; M-GAA: median dose (20 mg/kg) of GAA; H-GAA: high dose (30 mg/kg) of GAA. **P<0.01 and ***P<0.001 compared with the sham group; &P<0.05 and &&P<0.01 compared with the MCAO group; #P<0.05 and ##P<0.01 compared with the PSD group.
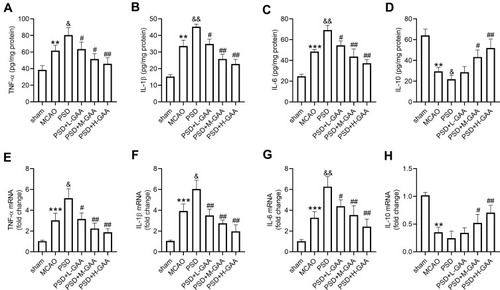
Figure 4 Influence of GAA on microglial phenotypic profiles and polarization. (A–C) qRT-PCR and Western blotting for expression levels of iNOS and CD86 in hippocampus tissues. (D–F) qRT-PCR and Western blotting for expression of Arg-1 and CD206 in hippocampus tissues. n=8. MCAO: stroke model; PSD: CUMS after MCAO; L-GAA: low dose (10 mg/kg) of GAA; M-GAA: median dose (20 mg/kg) of GAA; H-GAA: high dose (30 mg/kg) of GAA. **P<0.01 and ***P<0.001 compared with the sham group; &P<0.05 and &&P<0.01 compared with the MCAO group; #P<0.05 and ##P<0.01 compared with the PSD group.
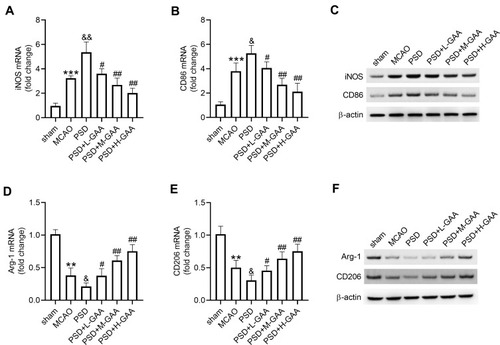
Figure 5 Impact of GAA on activation of the ERK/CREB pathway in PSD rats. (A–C) Western blotting for phosphorylation levels of ERK and CREB in hippocampus tissues. n=8. MCAO: stroke model; PSD: CUMS after MCAO; L-GAA: low dose (10 mg/kg) of GAA; M-GAA: median dose (20 mg/kg) of GAA; H-GAA: high dose (30 mg/kg) of GAA. **P<0.01 compared with the sham group; &P<0.05 and &&P<0.01 compared with the MCAO group; #P<0.05 and ##P<0.01 compared with the PSD group.
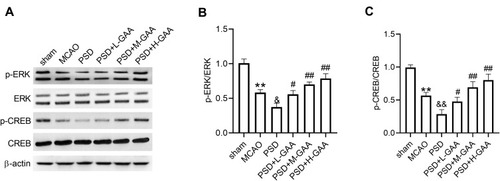
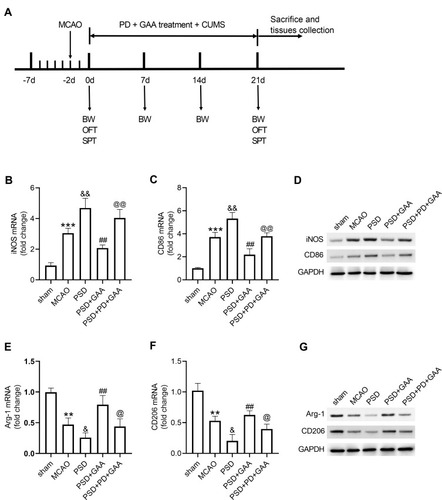
Figure 6 Effect of GAA on M1/M2 microglial polarization depends on the ERK/CREB pathway. (A) Experimental timeline. (B–D) qRT-PCR and Western blotting for expression of iNOS and CD86 in hippocampus tissues. (E–G) qRT-PCR and Western blotting for expression of Arg-1 and CD206 in hippocampus tissues. n=8. MCAO: stroke model; PSD: CUMS after MCAO; GAA: high dose (30 mg/kg) of GAA; PD: 100 μM PD (ERK inhibitor). **P<0.01 and ***P<0.001 compared with the sham group; &P<0.05 and &&P<0.01 compared with the MCAO group; ##P<0.01 compared with the PSD group; @P<0.05 and @@P<0.01 compared with the PSD+GAA group.