Figures & data
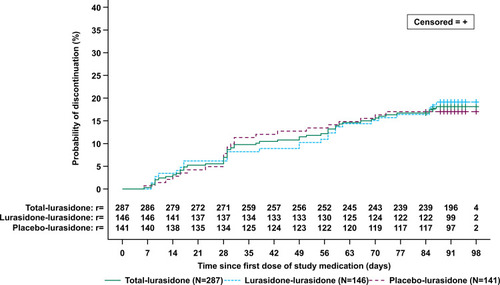
Figure 1 Patient disposition.
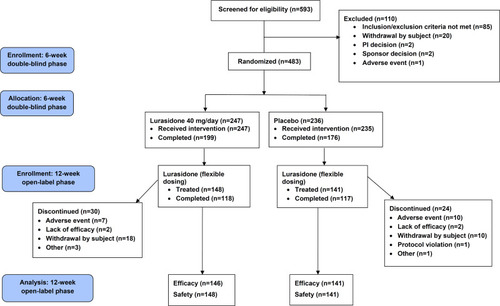
Table 1 Demographics and Open-Label Baseline Characteristics of Patients in the Open-Label Treatment Period (Safety Population)
Table 2 Summary of Adverse Events That Occurred in at Least 2% of Subjects in the Overall Population (Safety Population)
Table 3 Mean (SD) Change from Open-Label Baseline to Week 12 in Weight, BMI, Laboratory Parameters, and ECG Parameters (Safety Population)
Figure 2 PANSS total score – mean change from double-blind baseline over time (Intent-to-treat population).
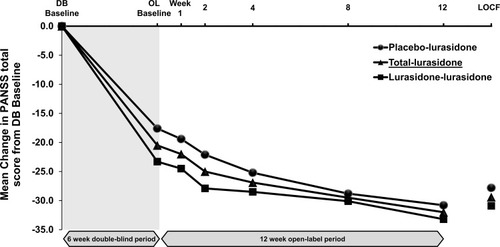
Figure 3 PANSS total score in Japanese subpopulation – mean change from double-blind baseline over time.
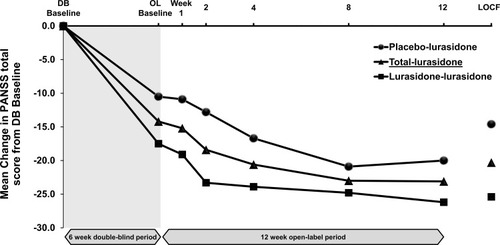
Table 4 Mean (SD) Change from Double-Blind and Open-Label Baseline to LOCF Endpoint in Secondary Efficacy Measures (ITT Population)
Figure 4 Time from open-label baseline to all-cause discontinuation-Kaplan–Meier Plot (Intent-to-treat population).