Figures & data
Figure 1 Study diagram including definition of the evaluation period and index date in each group.
Abbreviation: ADHD, attention-deficit/hyperactivity disorder.
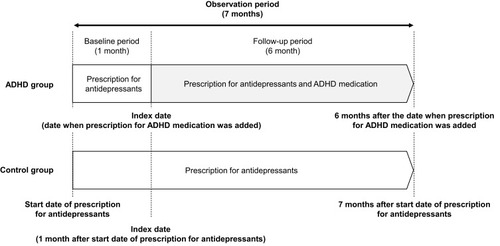
Figure 2 Patient disposition.
Notes: “Anxiolytics” and “hypnotics” in each group refer to patients who received a prescription for anxiolytics and hypnotics, respectively, 1 month prior to the index date (in the ADHD group) or at the index date (in the control group).
Abbreviations: ADHD, attention-deficit/hyperactivity disorder; JAMDAS, Japanese Medical Data Survey.
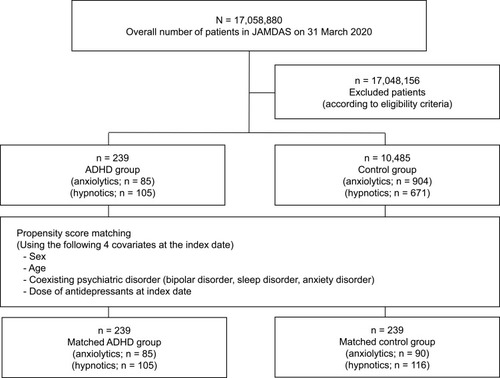
Table 1 Patient Demographic and Baseline Characteristics
Figure 3 Percentage of patients receiving prescriptions for antidepressants in matched cohort.
Abbreviations: ADHD, attention-deficit/hyperactivity disorder; NS, not significant.
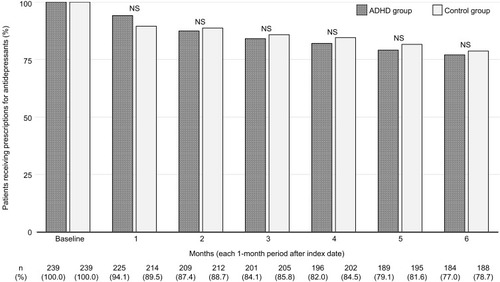
Figure 4 (A) Mean prescribed dosage of antidepressants (in imipramine equivalents) in matched cohort by total patients. (B) Mean prescribed dosage of antidepressants (in imipramine equivalents) in matched cohort by patients receiving antidepressants.
Abbreviations: ADHD, attention-deficit/hyperactivity disorder; NS, not significant; SD, standard deviation.
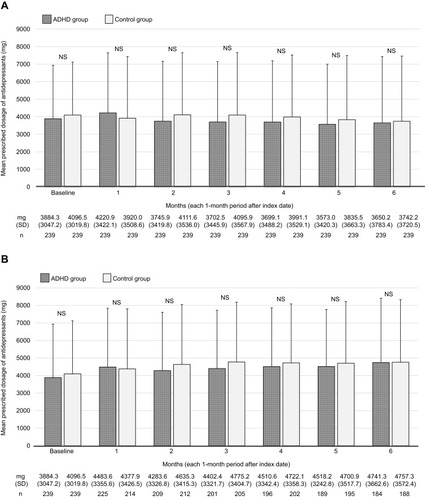
Figure 5 Percentage of patients receiving prescriptions for anxiolytics in matched cohort.
Abbreviations: ADHD, attention-deficit/hyperactivity disorder; NS, not significant.
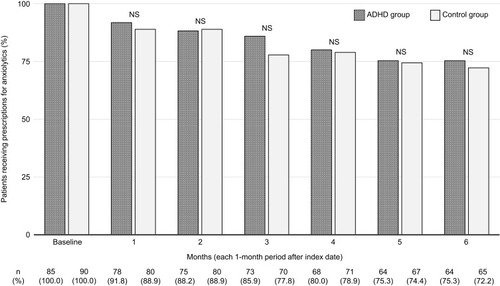
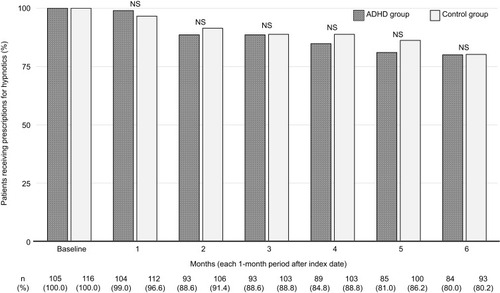
Figure 6 Percentage of patients receiving prescriptions for hypnotics in matched cohort.
Abbreviations: ADHD, attention-deficit/hyperactivity disorder; NS, not significant.